Service reports
Service Management has two report layers: a quick summary inside the module itself and a full family of management reports in the platform's Reports hub.
Quick summary
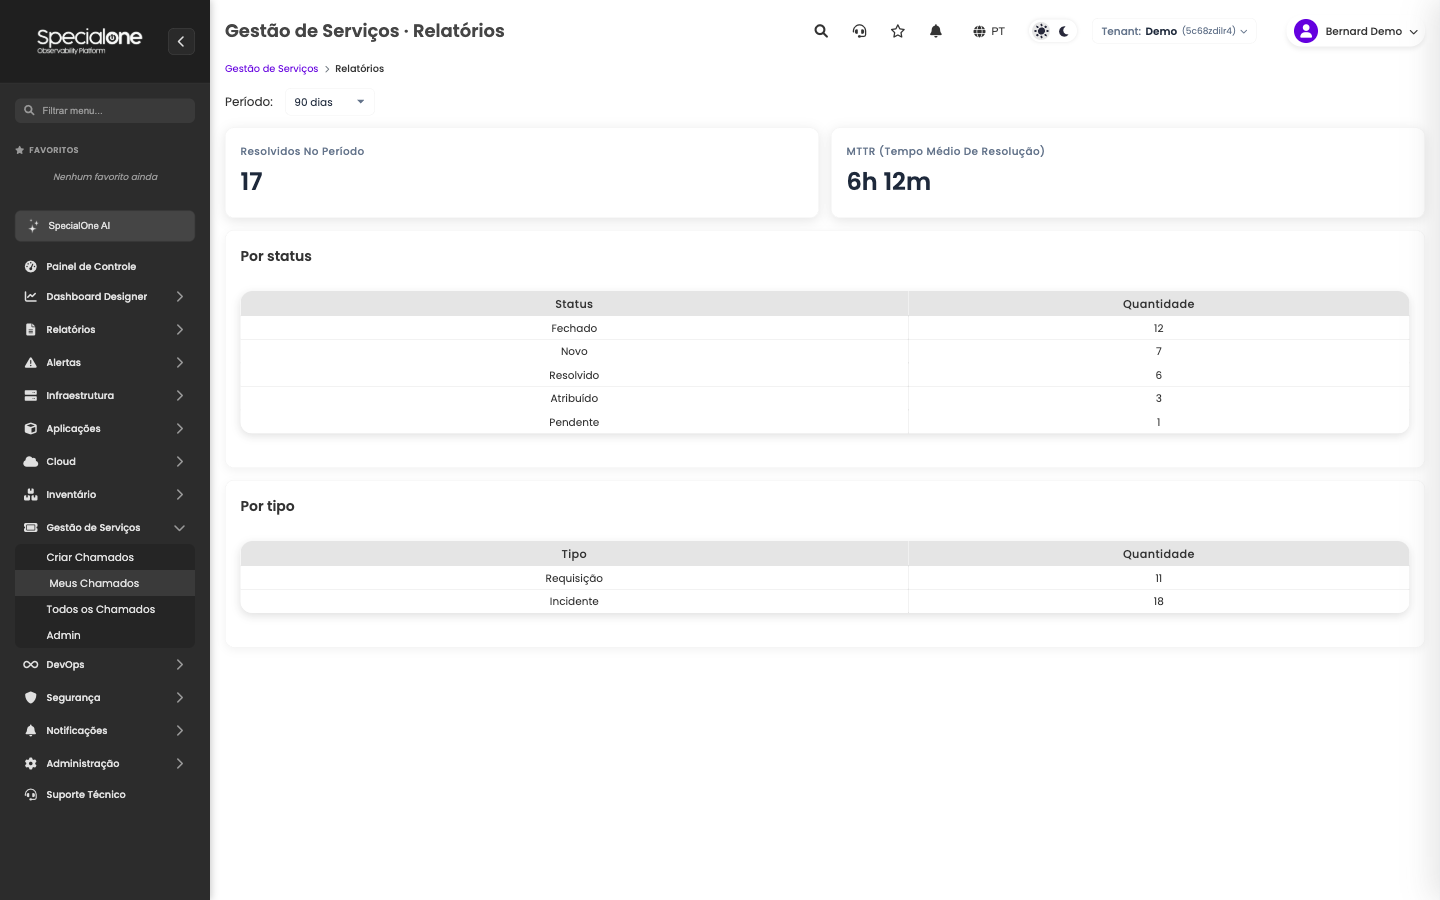
In Service Management → Reports, the pulse of the period (7, 30 or 90 days): resolved tickets, MTTR (mean time to resolution) and the breakdowns by status and type. Good for day-to-day checks without leaving the module.
The full family in the Reports hub
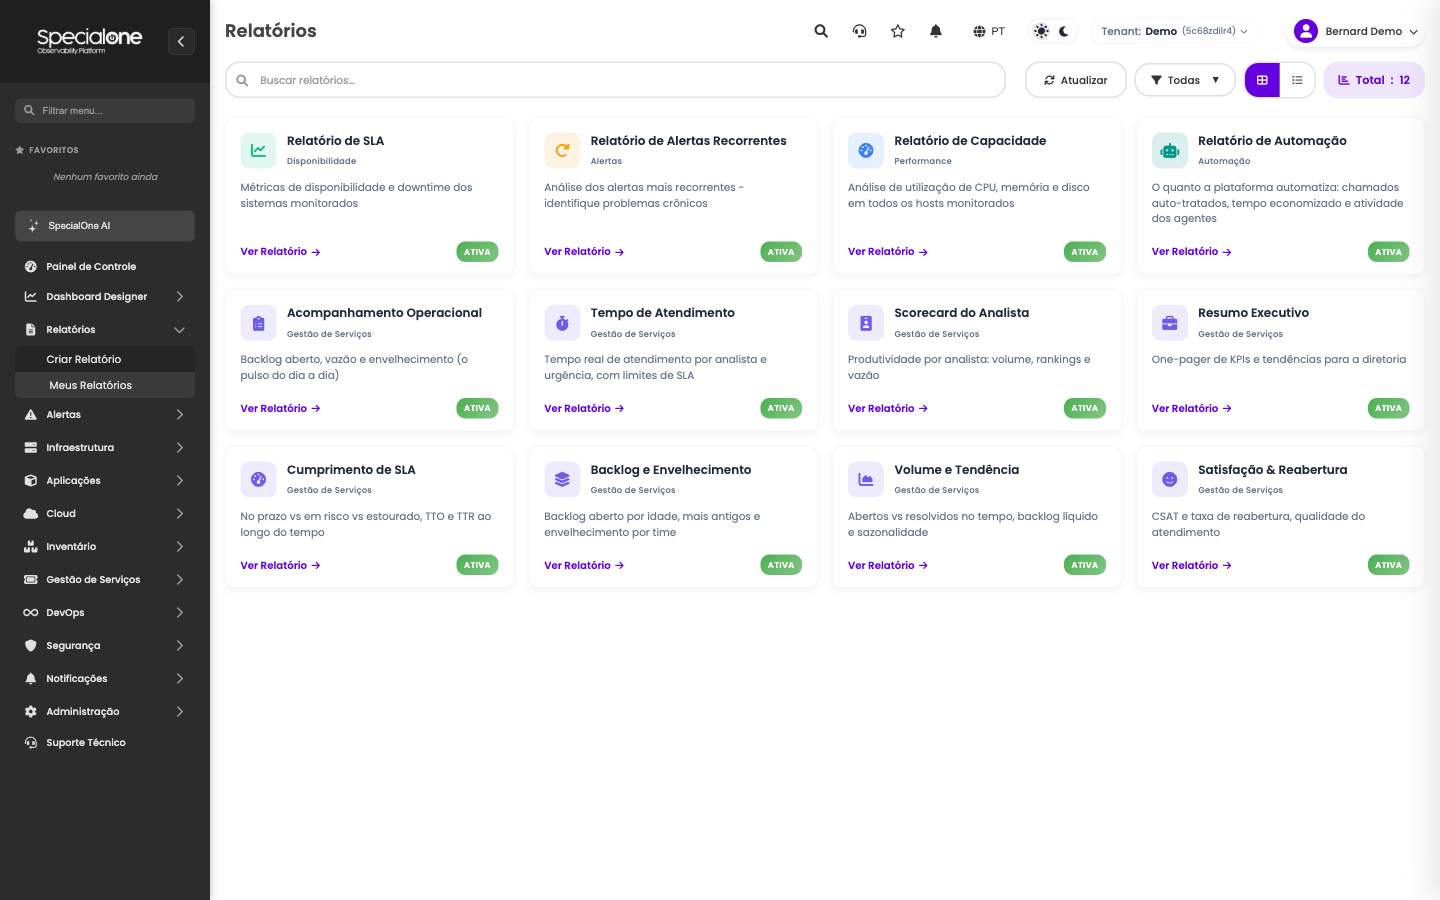
In Reports, the Service Management category brings nine ready-made management reports:
| Report | What it answers |
|---|---|
| Operational Tracking | open backlog, throughput and aging, the day-to-day pulse |
| Response Time | real handling time by analyst and urgency, with SLA limits |
| Analyst Scorecard | productivity per analyst: volume, rankings and throughput |
| Executive Summary | a KPI and trends one-pager for leadership |
| SLA Compliance | on time vs at risk vs breached, TTO and TTR over time |
| Backlog and Aging | open backlog by age, the oldest tickets and aging per team |
| Volume and Trend | opened vs resolved over time, net backlog and seasonality |
| Board Presentation | the executive view ready to project in a meeting |
| Satisfaction & Reopening | CSAT and reopen rate, the quality thermometers |
How the reports work
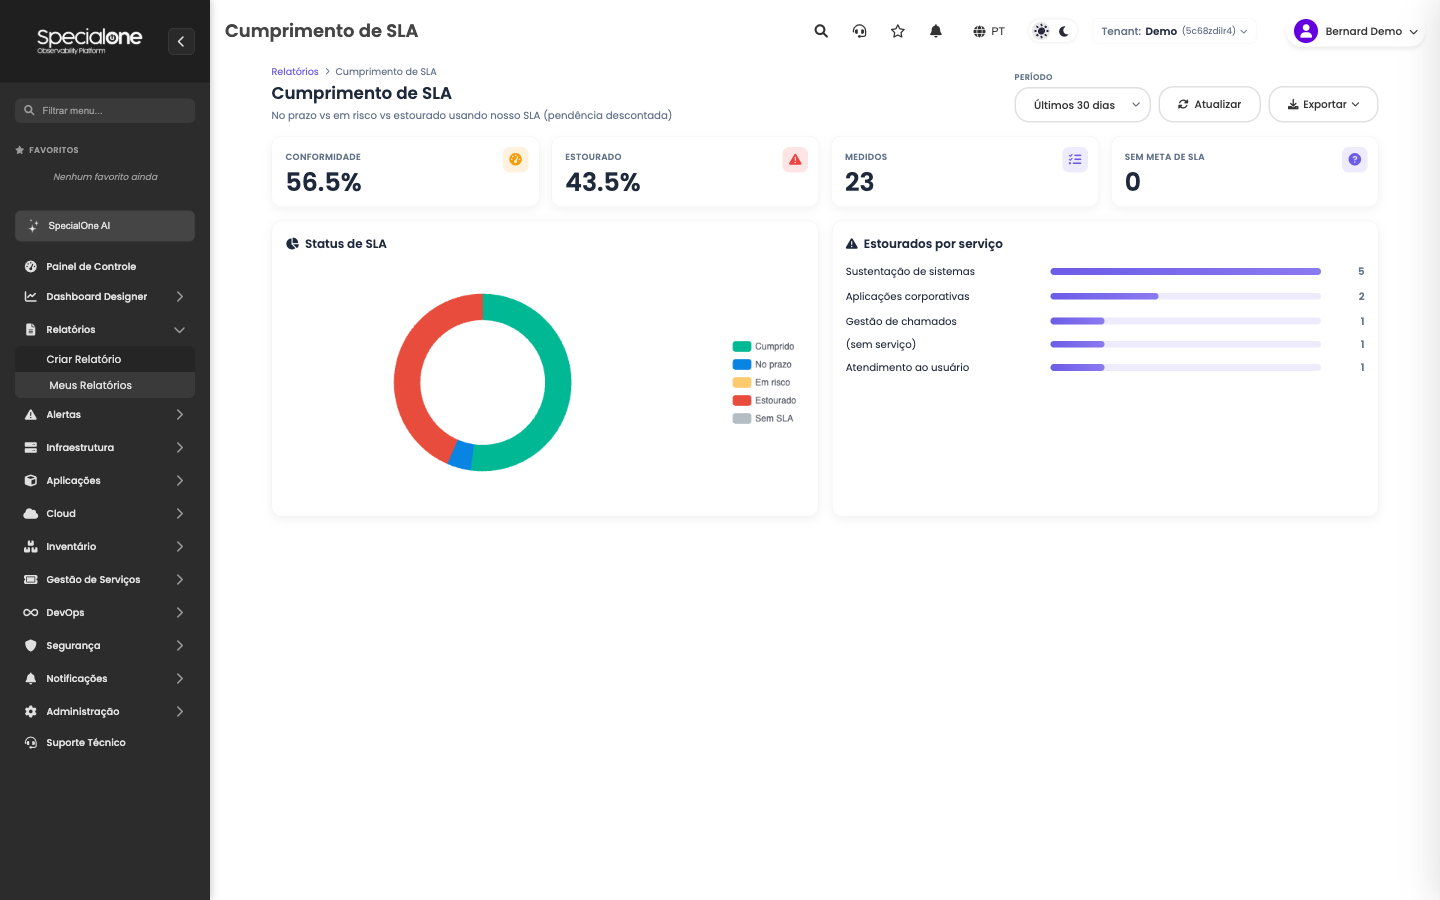
They all follow the same usage pattern:
- Configurable period on top, with Refresh and Export.
- KPI cards and charts with the breakdown that matters (in the example, SLA status and breaches by service).
- Drilldown: clicking a number opens the ticket list filtered by that slice, straight from the chart to the tickets behind it.
- SLA math uses your tenant's targets and deducts Pending time, the same criteria shown inside the ticket.
Access follows the profile (coordinator and up). For quick questions without opening a report, the AI assistant answers on the spot: "how many tickets did we open this month?", "how is SLA compliance?".