Inventory
Page with a consolidated asset inventory: single, by-category view of everything cataloged on the platform. Works as a lightweight CMDB, with totals and shortcuts to the detailed list of each category.
Unlike the resource-specific pages (Hosts, Docker, Kubernetes, Network, Storage, DCIM), which handle active monitoring of resources, Inventory focuses on cataloging and counting. It is the natural entry point to answer "how many items of each type do I have?" and "where is the full list of X?".
Overview
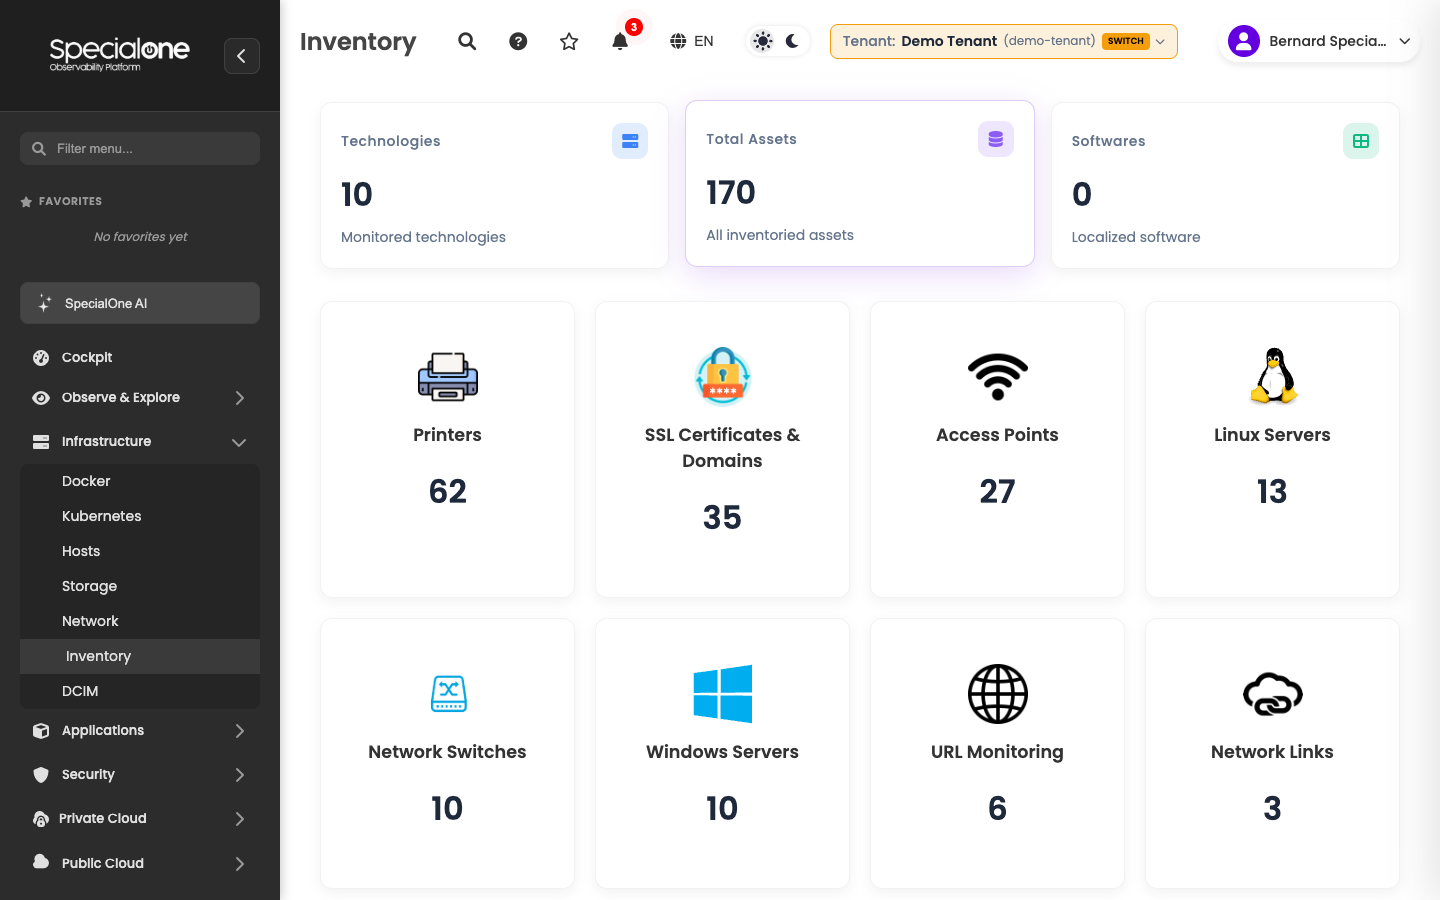
Reached from Infrastructure → Inventory. The page has two parts:
On top, three consolidated KPIs:
| KPI | What it counts |
|---|---|
| Technologies | How many different asset categories are present on the tenant. |
| Total Assets | Sum of every inventoried item across all categories. |
| Softwares | How many software packages were located by inventory collection on managed hosts. |
Below, a grid of per-category cards with the count on each one. Typical categories include:
- Printers (managed via SNMP).
- SSL Certificates & Domains (with expiry date tracked).
- Access Points (Wi-Fi controllers and APs).
- Linux Servers and Windows Servers.
- Network Switches.
- URL Monitoring (synthetic checks).
- Network Links (circuits with peering).
- Fortinet (firewalls and security appliances).
- SAP Systems.
Each card is a shortcut to the detailed list of that category.
Visible categories vary per tenant
The cards shown reflect the monitoring profiles applied to the tenant. A customer without a SAP environment, for instance, will not see the SAP Systems card. As new asset types come into monitoring, new cards appear here automatically.
Detailed list by category
Clicking any card opens the full list of that category.
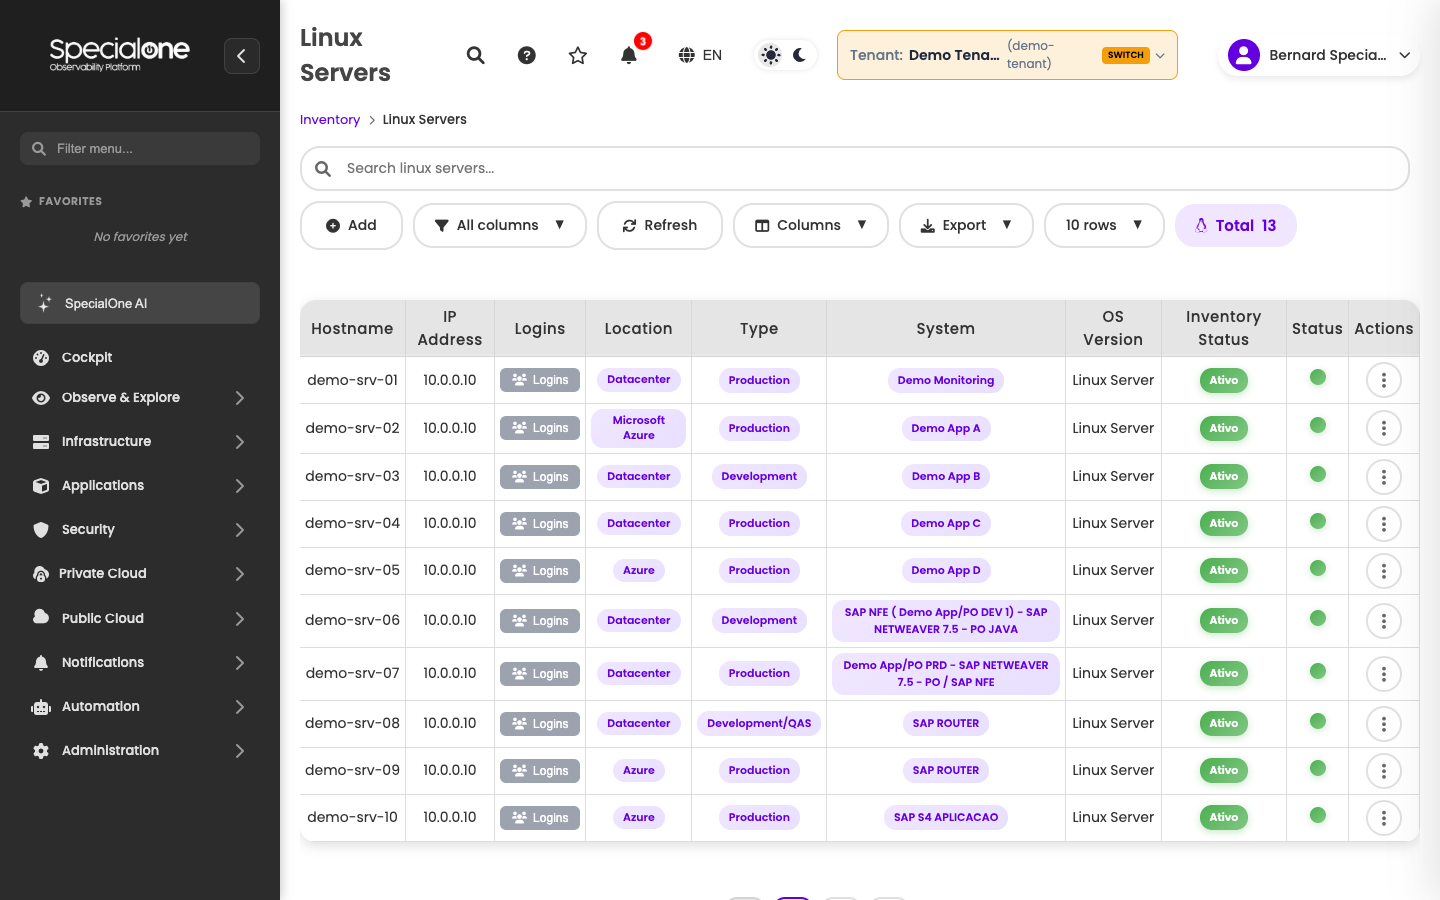
The list structure varies by asset type, but typically brings:
| Column | What it shows |
|---|---|
| Host | Asset identifier. |
| IP Address | Management IP. |
| Logins | Who accessed the asset recently, when integrated with audit. |
| Location | Where the asset sits physically or logically (datacenter, cloud provider). |
| Type | Environment (production, staging, development). |
| System | Application or function of the asset. |
| OS Version | When applicable (servers). |
| Inventory Status | Whether the inventory collection is up to date. |
| Status | Consolidated state. |
| Actions | Quick operations menu. |
Above the table sit standard controls (search, column filters, refresh, pick columns, export, pagination) and the Add button, which opens manual registration for an asset of the category (when supported).
Inventory is not the entry point to monitor
Registering here adds the asset to the catalog. For active monitoring (metrics, alerts), inclusion happens on the resource-specific pages, like Hosts, Network or DCIM. Inventory consumes the assets discovered or registered on those pages and shows the consolidated result.
How assets show up here
There are three paths for an asset to enter the inventory:
- Automatic discovery: the collector finds a new resource on the network and, after approval, it is cataloged.
- Registration via resource-specific pages: adding a host on Hosts, a cluster on Kubernetes or a device on Network makes the asset appear here automatically.
- Manual registration here: when the category supports it, you add the asset directly on the Inventory page (useful for items not actively monitored, like certificates or network links).
Anything on the inventory may or may not have active metric collection, depending on the origin path.
Where this is useful
The Inventory answers questions that other pages do not answer as easily:
- Compliance and audit: total assets per category, with the date of the latest collection.
- Software inventory: list of packages installed on the hosts (when the agent collects).
- Expiry tracking: SSL certificates and domains with dates close to expiring (under the Certificates category).
- Capacity: how many hosts/devices per type, basis for growth planning.
- Customer onboarding: quick view of what is already being monitored on a freshly registered environment.
Next steps
-
Hosts
Detail of Linux and Windows servers, with metrics and alerts.
-
How alerts work
From alert definition to notification channel.