Kubernetes
Dedicated page to track Kubernetes clusters. Unlike Docker, where the monitored unit is the host running the engine, here the unit is the whole cluster: monitoring understands workloads, deployments, pods and nodes as parts of one logical object.
Navigation, the Configuration tab and the Alerts tab follow the same model as Hosts. What changes is registration (which involves installing a Helm chart on the cluster) and the content of the metrics panels.
The list
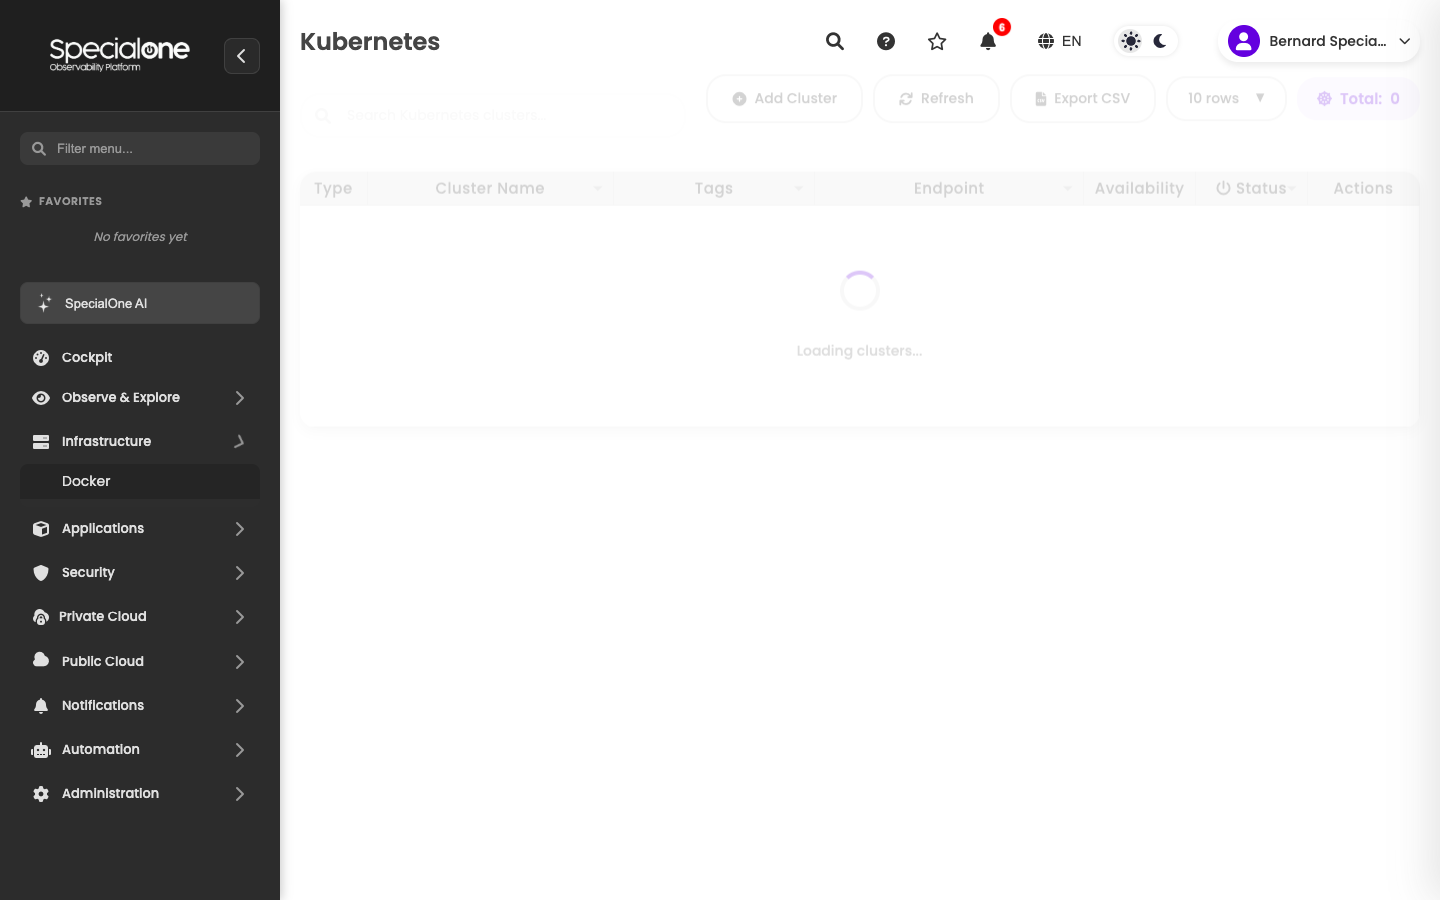
Reached from Infrastructure → Kubernetes. Shows registered clusters in the tenant, with columns:
| Column | What it shows |
|---|---|
| Type | Cluster distro (vanilla, EKS, AKS, GKE, OpenShift). |
| Cluster Name | How it appears on the platform. |
| Tags | Labels attached to the cluster. |
| Endpoint | Kubernetes API URL the platform queries. |
| Availability | Indicator of the latest health check. |
| Status | Consolidated overall state. |
| Actions | Quick operations menu. |
On a fresh tenant the list is empty. Use Add Cluster on top to start (see Adding a cluster).
Adding a cluster
Unlike Docker, here monitoring is set up by a Helm chart installed inside the cluster, which opens collection and returns a token you paste back on the platform. The full flow fits in seven steps.
Prerequisites
Before you begin, make sure you have:
- Admin access to the Kubernetes cluster (permission to create namespace, ServiceAccount, ClusterRole and ClusterRoleBinding).
kubectlconfigured and pointing to the cluster (kubectl get nodesshould respond).- Helm 3.x installed on the machine where you will run the install.
- Network between cluster and SpecialOne working: either the platform reaches the
kube-apiserver, or the SpecialOne collector sits on a network with access to it.
Step by step
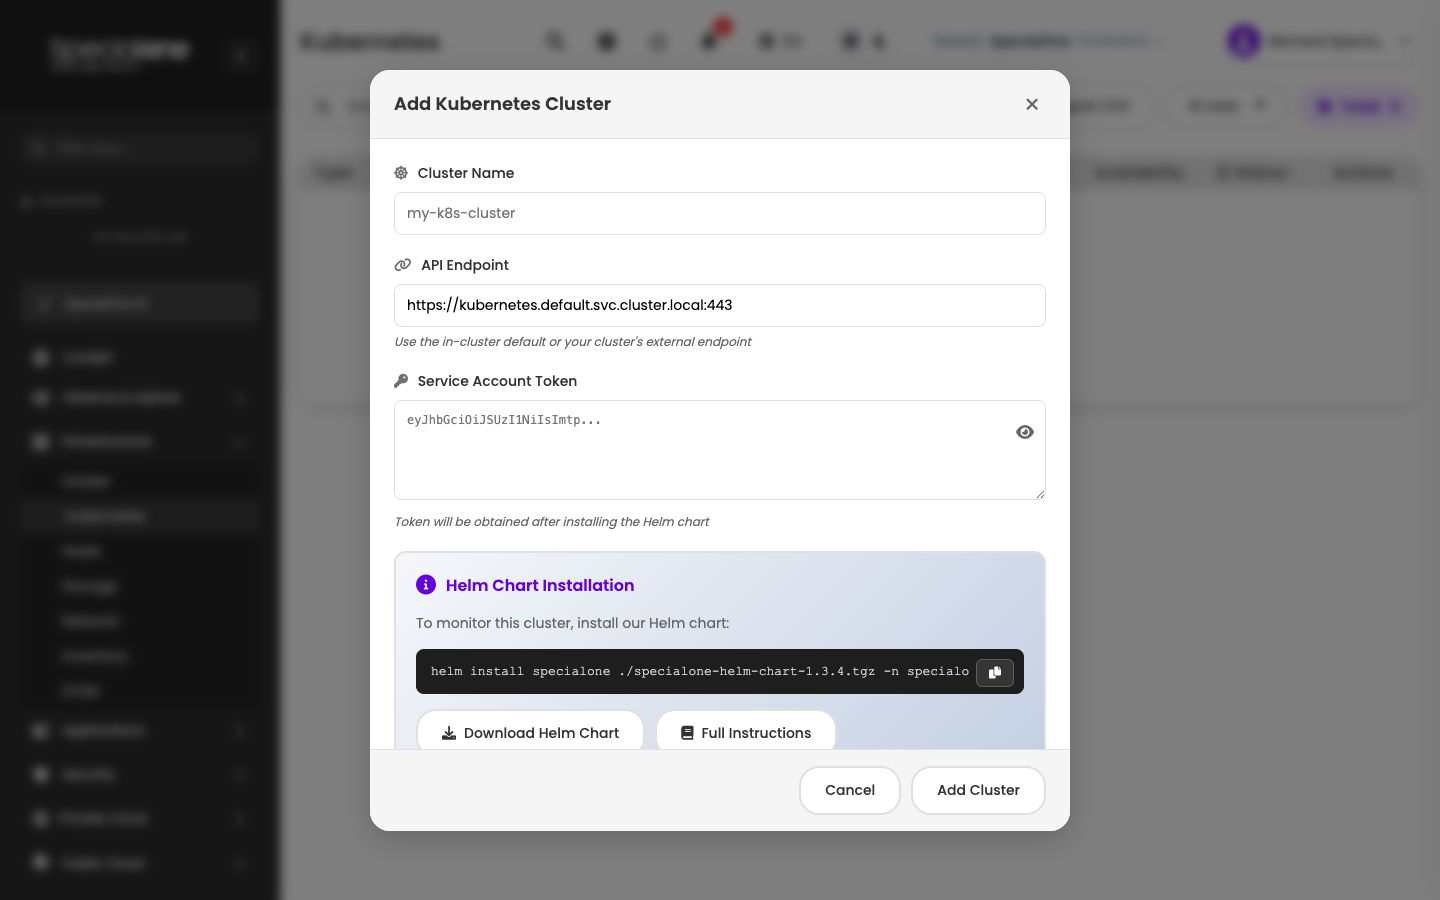
1. Open registration on the platform
Under Infrastructure → Kubernetes, click Add Cluster.
2. Fill Cluster Name
How you want to see the cluster on the platform. Use a name that gives quick context, e.g. prod-eks-sa-east-1 or staging-rancher-customer-x.
3. Fill API Endpoint
Kubernetes API URL. Two options:
- Internal endpoint (
https://kubernetes.default.svc.cluster.local:443): if SpecialOne has a collector inside the same cluster or in a neighboring one with access to thekube-apiservernetwork. Faster and avoids exposing the control plane. - External control plane endpoint: if the collector lives on another network. It must be reachable and have a valid certificate.
4. Download the Helm chart
The modal has a Download Helm Chart button that delivers a .tgz (e.g. specialone-helm-chart-1.3.4.tgz).
5. Install the chart on the cluster
Open the terminal on the machine where kubectl and helm point to the cluster, go to the folder where the .tgz was saved and run:
The chart creates the specialone namespace, a ServiceAccount with read permissions and the pods that collect cluster metrics and events. Verify it is up:
Pods should be Running.
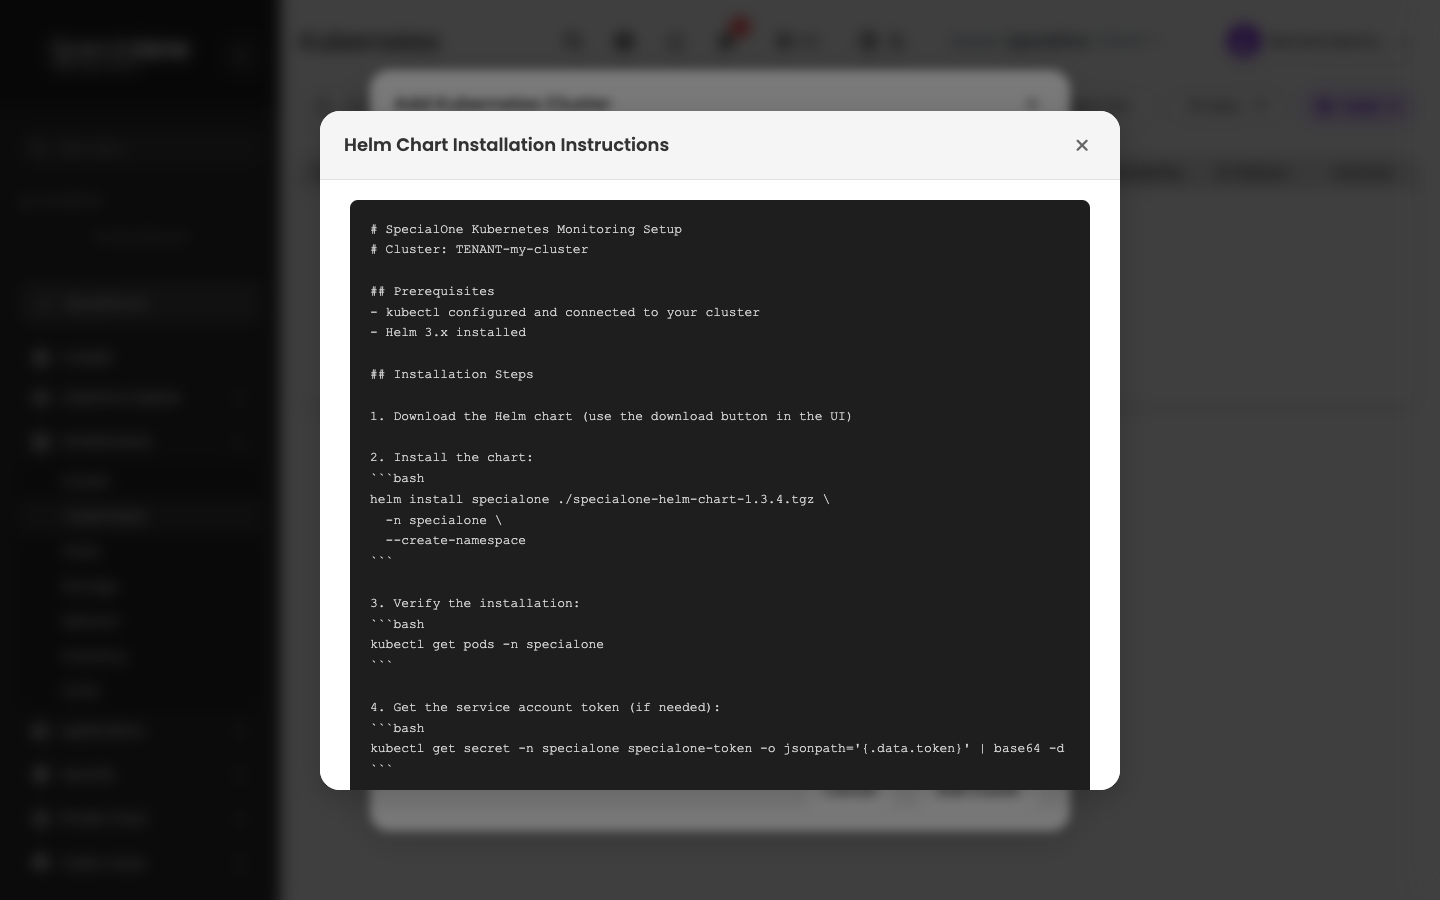
The Helm Chart Installation Instructions modal (reachable from the Full Instructions button on the registration screen) ships these same commands ready to copy.
6. Retrieve the Service Account Token
Still on the cluster, run:
It returns a long string (the token). Copy the whole thing.
7. Back on the platform, paste the token and save
Paste it in the Service Account Token field of the registration modal and click Add Cluster.
After saving
The cluster shows up on the Kubernetes list. Within minutes:
- The Availability column turns green when the platform confirms communication with the
kube-apiserver. - The Status column reflects the consolidated state.
- Cluster metrics start populating, and alerts configured by the default profile (CrashLoopBackOff, NotReady, etc.) become active.
Reinstalling with a new chart version
When SpecialOne releases a new chart version, the recommended path is to download the new .tgz from the registration modal and run helm upgrade specialone ./specialone-helm-chart-X.Y.Z.tgz -n specialone. The cluster stays in the list, no re-registration needed.
The cluster detail
Clicking on a registered cluster opens the detail with tabs in the same format as Docker and Hosts: Metrics, Workloads, Alerts and Configuration. The first two have Kubernetes-specific content:
- Metrics: cluster-wide health (nodes ready, total CPU and memory capacity, pods in abnormal states, global restart count) and per-namespace charts.
- Workloads: list of deployments, statefulsets, daemonsets and jobs, with state (desired/actual replicas), age and namespace. Natural entry point to investigate "which app has a stuck pod".
Alerts and Configuration tabs
Both follow the same model as any resource on the platform. To avoid repetition, refer to the Hosts page:
- Configuration tab: cluster attributes, applied monitoring profiles, collected metrics and configured alerts.
- Editing an alert on the host: how the custom copy works when you tune a profile-inherited alert.
The practical difference is just the set of applicable profiles. A cluster usually gets profiles tailored for the control plane, networking components and per-namespace resources.
Typical cluster alerts
The default profiles cover common situations you will see in the cluster's Configured Alerts sub-tab:
- Pods in CrashLoopBackOff or ImagePullBackOff in a namespace.
- Deployments with replicas below desired for too long.
- Node NotReady (
NotReadyorMemoryPressure). - CPU/memory capacity close to the limit on the cluster.
- Pending PersistentVolumeClaims without provisioning.
- API certificates close to expiry.
Like any alert, they are routed by your notification rules and can be silenced via maintenance during planned deploys.
Next steps
-
Docker
For standalone Docker nodes and swarms without Kubernetes, see the Docker page.
-
How alerts work
From alert definition to notification channel: full vocabulary.