VMware
Dedicated page for VMware vSphere environments monitored by the platform. Each registered vCenter becomes an entry on the list, and from it the platform pulls inventory (ESXi hosts, datastores, virtual machines) and metrics via vCenter API.
Collection is done by the collector (hub) talking directly to vCenter over HTTPS: no agent on ESXi or VMs in this flow, unlike Hosts. That is why registration is independent of the Hosts page (you add the vCenter directly here, similar to Network).
Who uses it
- SRE and operations: tracks ESXi host availability, datastore saturation and cluster alerts.
- Virtualization team: sees inventory, VM distribution per host, stale snapshots left behind.
- Infra/Capacity: uses historical metrics to plan consolidation, cluster expansion or datastore migration.
The list
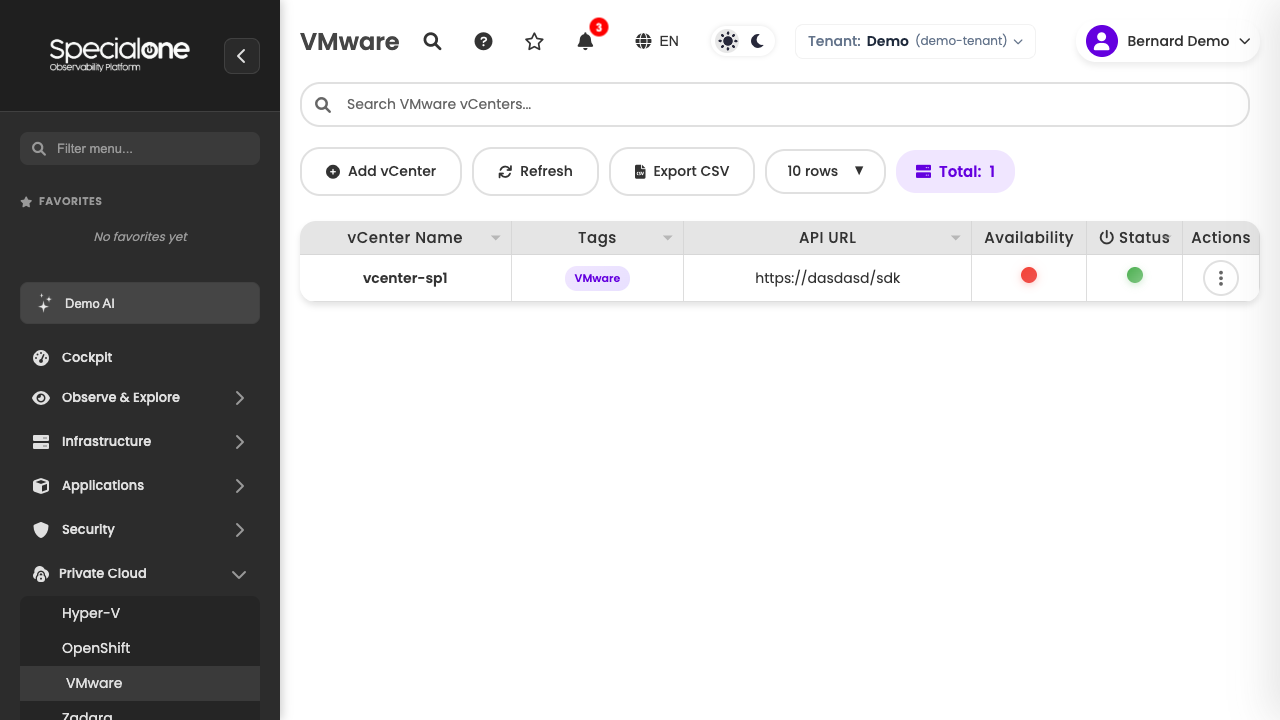
Reached from Cloud → VMware (route /vmware-monitoring). The columns reflect what matters in vSphere:
| Column | What it shows |
|---|---|
| vCenter Name | How the vCenter appears on the platform (e.g. vcenter-prd-corp). |
| Tags | Free labels (e.g. production, dr-site, cluster-a). |
| API URL | Endpoint used by the collector (e.g. https://vcenter.example.com/sdk). |
| Status | Consolidated indicator of connectivity and collection health. |
| Actions | Menu with edit, delete and shortcut to the detail. |
Above the table sit the standard controls (search, refresh, export CSV, rows per page, total count) and the Add vCenter button.
One vCenter, many entities
Each row here represents one vCenter, not an ESXi host nor a VM. Inventory is available inside the drill-down. If you operate multiple vCenters (separate sites, lab/production environments), register each as an independent entry.
Adding a vCenter
Registration happens right on the page, without depending on an existing host. The flow mirrors Network: fill a form, save, the collector starts trying the connection.
Prerequisites
Before registering, make sure:
- The collector (hub) has network reachability to the vCenter on HTTPS port 443. The collector is the one making API calls, so it needs to hit
vcenter.example.com(or IP) on 443/TCP. - There is a dedicated read account on vCenter, with the Read-Only role applied at the top of the hierarchy (or on every datacenter that must be monitored). Do not use an administrative account.
- You have on hand: full endpoint URL (
https://vcenter.example.com/sdk), username (formatted asmonitor@vsphere.localorDOMAIN\\monitor) and password. - The vCenter certificate is reachable. If it is self-signed, that is handled on the certificate validation option during registration.
Step by step
- Under Cloud → VMware, click Add vCenter.
- Fill the fields:
- vCenter Name: how it appears on the platform (e.g.
vcenter-prd-corp). - API URL: full endpoint including
/sdkat the end (e.g.https://vcenter.example.com/sdk). - Username: dedicated read account (e.g.
monitor@vsphere.local). - Password: account password.
- Collector: which hub will talk to the vCenter. On environments with more than one, pick the one with the proper route and firewall rules.
- Tags: free labels for grouping (e.g.
production,site-sp).
- vCenter Name: how it appears on the platform (e.g.
- Click Add vCenter.
The entry shows up on the list. The collector runs the first API call within minutes: on successful authentication, Status turns healthy and inventory starts populating. If it stays in error, review URL, credential and connectivity.
Dedicated, not administrative credential
The vSphere Read-Only role is enough for inventory and performance metrics. An administrative account widens the risk surface with no monitoring gain, and makes it harder to audit who did what in the environment.
vCenter detail
Clicking a row (or the shortcut on the actions menu) takes you to the drill-down page with charts specific to that vCenter.
The detail groups information in blocks:
- ESXi host inventory: total count, distribution per cluster, hosts in maintenance, disconnected hosts. CPU and memory consolidated (capacity vs usage).
- Datastores: list with total capacity, used and free space, percent full, datastores near the limit highlighted in alert. Type (VMFS, NFS, vSAN) when exposed by the API.
- Virtual machines: total count, powered on/off, with stale snapshots, with outdated tools. Top N by CPU, memory and I/O usage.
- Clusters and HA: cluster state, DRS, HA, number of active hosts per cluster.
- Related alerts: list of open platform alerts tied to the vCenter, its ESXi hosts, datastores or VMs derived from it. Shortcut to Alerts with a ready filter.
- Performance: historical series of CPU, memory, datastore latency, aggregated network throughput, with a window selector (1h, 6h, 24h, 7d, 30d).
Inner filters
Inside the detail there are filters to isolate a specific cluster, a datacenter or a tag set. Useful when the vCenter aggregates mixed environments (production and lab on the same vCenter, for example).
Editing and managing
The Actions menu on each list row offers:
- Edit: tweaks name, URL, credential, associated collector and tags. After save, the collector uses the new data on the next cycle.
- Delete: removes the vCenter from the list. Deletion removes the registration and stops collection, but historical metrics already stored are preserved under the tenant's retention policy.
- Open detail: shortcut to the drill-down page with charts.
Bulk tag changes
To reorganize tags across many vCenters, edit one at a time. There is no bulk action on this page (the typical number of vCenters per tenant rarely justifies one).
Rotating the credential
When the read account password is rotated, edit the vCenter and update the Password field. The collector picks up the new credential on the next cycle. There is no need to re-register the vCenter.
Typical VMware alerts
The default profiles applied to vCenter cover what tends to burn pager time in vSphere:
- vCenter unreachable: API does not respond, authentication failed, certificate expired. Severity Critical.
- ESXi host offline or disconnected from vCenter. Severity Critical.
- Datastore with low free space (configurable threshold, typically 85% for High and 95% for Critical).
- Datastore with high latency (read or write above normal, sign of saturation or degraded hardware). Severity High.
- Cluster HA degraded: number of active hosts in the cluster dropped, failover reservation compromised. Severity High.
- VM with stale snapshots (older than N days). Severity Medium or Information, depending on the tenant policy.
- VM with outdated or missing VMware Tools. Severity Information.
- CPU/memory of the cluster above the limit sustained. Severity High.
These alerts follow the same routing flow via notification rules and can be silenced via maintenance during host patching windows or storage migration.
Limits
- API timeout: each vCenter call has a timeout of around 30 seconds. Very large environments (hundreds of hosts, thousands of VMs) may have longer collection cycles, partitioned by entity.
- Collection frequency: inventory (hosts, datastores, VMs) is refreshed on wider cycles, performance (CPU, memory, latency) on shorter ones. The effective cycle follows the applied monitoring profile.
- List pagination: the table supports standard pagination (10, 25, 50, 100 rows per page). In general the number of vCenters per tenant fits on the first page.
- One credential per vCenter: today each vCenter uses a single credential. If you need different credentials for datacenters inside the same vCenter, consider registering as two separate logical resources (rarely needed).
- Automatic discovery: there is no automatic vCenter scan on the network. Every monitored vCenter comes from the manual registration described above.
Next steps
-
ESXi hosts as regular hosts
You can complement vCenter monitoring by applying specific profiles directly to ESXi hosts registered under Hosts.
-
Alerts and notifications
From alert definition to notification channel.
-
Other direct registrations
Network devices follow the same standalone-on-page registration pattern.