Alerts
Day-to-day operations page. Lists every open alert on the tenant in real time, with filters, sorting and quick actions for the team to act.
This is the screen that stays open on the NOC wall, on the second monitor during on-call shifts, and on the phone of whoever is on standby.
Open alerts vs History
This page shows only what is happening right now. Alerts that already closed (resolved automatically or by intervention) leave this page and show up under Alerts History.
Reach it from Observe & Explore → Alerts.
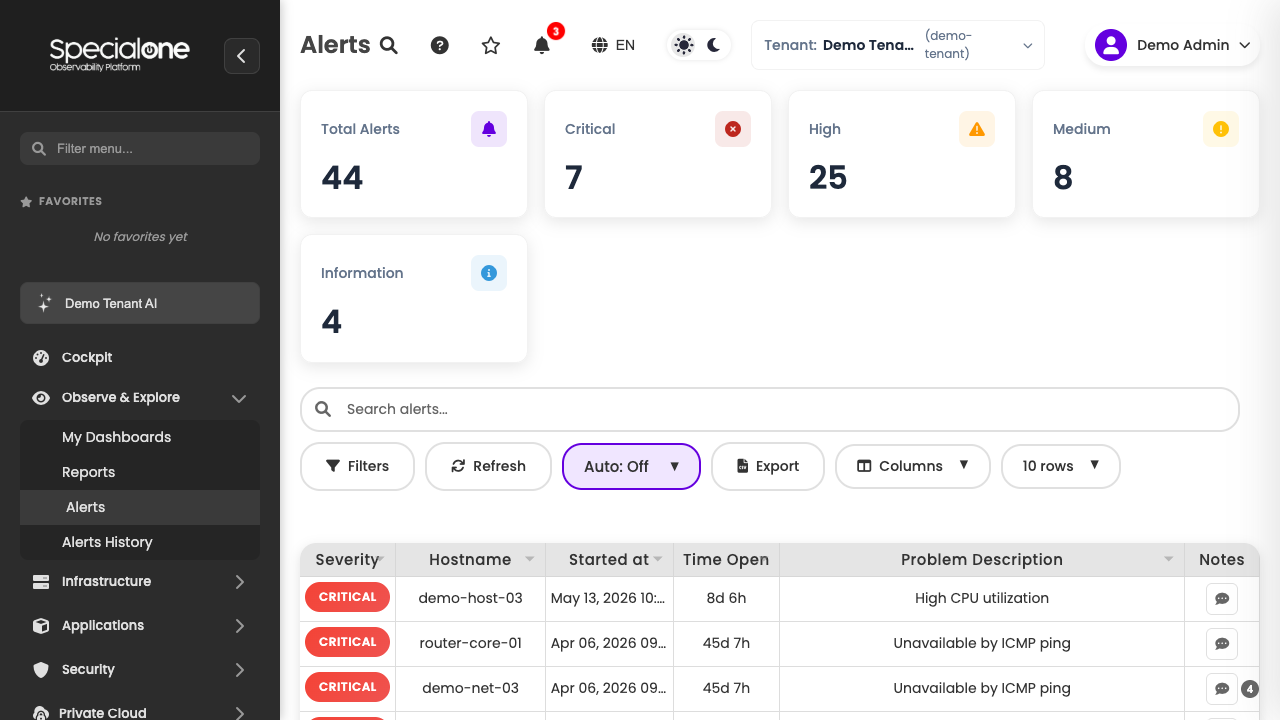
KPIs on top
The five cards on top summarize the current tenant state:
| Card | What it counts |
|---|---|
| Total Alerts | Sum of every open alert, regardless of severity. |
| Critical | Alerts with critical severity firing now. |
| High | High-severity alerts. |
| Medium | Medium-severity alerts. |
| Information | Open informational alerts. |
The cards are clickable: clicking Critical filters the table to show only critical alerts. Clicking again clears the filter. Triage in three clicks: look at the number, filter, act.
Critical is the first stop
On a NOC shift the first reflex is to look at Critical. If it is zero, the rest can wait for the normal triage cycle. If there is a number, that is where the team goes first.
The alerts table
The table is the heart of the page. Each row is an open alert at this moment.
| Column | Content |
|---|---|
| Severity | Colored badge: Critical (red), High (orange), Medium (yellow), Information (blue). |
| Hostname | Affected host. Click to open the host detail. |
| Started at | Exact date and time when the alert started (browser timezone). |
| Time Open | Duration since the start. Updates live (1 min, 2 min, 1h 23 min, etc). |
| Problem Description | Alert rule message, descriptive text of what fired. |
| Notes | Comments added by the team directly on the alert row. |
The Problem Description column keeps that name in the interface even on a screen called "Alerts". It is the text of the definition that originated the event (see Alert in the glossary).
Sorting
Click any column header to sort. Useful for:
- Time Open descending: what has been open the longest comes first (chronic alerts surface).
- Started at descending: most recent alerts on top.
- Severity: groups by level.
Pagination
At the bottom you pick 10, 25, 50 or 100 rows per page. On environments with many open alerts, 25 is the balanced default. For a quick Ctrl+F sweep, bump to 100.
Quick search
The Search alerts... field above the table filters by free text inside hostname and problem description. It is the fastest way to find an alert when you know part of the host name or the message.
Shows any alert whose host or description contains "db-prod".
The search is incremental: type and the table filters in real time.
Advanced filters
The Filters button opens the side panel with combinable criteria:
By Host
Autocomplete field that suggests hosts from the tenant as you type. Pick one or more to restrict the table to alerts on those hosts.
By Tags
Filters by tags of the affected host. Useful to isolate by area (team:infra), environment (env:prod) or customer.
To combine multiple tags, pick the operator:
- Any (OR): alert qualifies if it has at least one of the tags.
- All (AND): alert qualifies only if it has every tag simultaneously.
By Severity
Checkboxes for the four levels. Lets you, for instance, look at only High + Critical while ignoring Medium and Information noise.
Panel buttons
- Clear All: resets every criterion.
- Apply Filters: confirms and refreshes the table.
Bookmark useful combinations
The platform encodes applied filters in the URL. Once you land on a useful combination ("infra prod critical+high"), bookmark the URL. Next shift you open the screen already filtered.
Auto-refresh
The Auto: Off / Auto: On dropdown controls the table auto-refresh:
- Off: nothing happens, you have to click Refresh manually.
- On: the table reloads on the configured interval.
For the NOC wall, keep On. For surgical investigation on a specific alert, turn it off so the row does not "disappear" while you read it when the alert resolves.
Auto-refresh does not replace notification
Whoever is on call should not sit staring at the wall waiting for an alert. The notification rules need to be set up to push the right alert on the right channel at the right time. This screen is for triage and action, not passive surveillance.
Notes on the alert
The action available on each row is the notes button (comment icon on the Notes column, on the right). When comments accumulate, the button shows the count as a badge.
Clicking opens a modal where you write a comment and confirm with Save (or Cancel to discard). Use it to:
- Document what the team found during investigation.
- Leave context for the next shift ("ticket #X already open with the vendor").
- Mark that someone took ownership ("I'm on it, Douglas 14:32").
- Register the action plan while the problem is being worked.
The note shows on the Notes column for everyone on the tenant and stays with the alert until it closes (it remains visible in Alerts History afterwards).
Use the note as a baton between shifts
The note is the natural hand-off channel. "Opened ticket #4521 with DBA team, ETA 1h, Douglas 14:32" is worth gold to whoever takes the next shift and does not have to rebuild context from scratch.
Export
Two buttons above the table:
- Export: generates a CSV with the alerts currently filtered. Useful for evidence in a report, attachment to a vendor ticket, or feeding a post-incident spreadsheet.
- Columns: picks which columns show on the table and which go into the exported CSV. If you only need host + description + time open, configure it here before exporting.
When a typical operation happens
To make screen usage concrete, three day-to-day scenarios:
Customer calls: "we're down"
- Open Alerts.
- Type the customer or host name into the Search alerts... field.
- Look at the Severity column of the rows that appeared. If there is Critical, that is where to start.
- Read the Problem Description and click the Hostname to open the host detail and understand what fired.
- Click the notes button on the row and register: "Customer confirmed impact, paging infra team, 14:05".
Team takes the fix
- Find the alert via search or the Critical card.
- Click the notes button on the row and register the plan: "DBA team paged via ticket #4521, ETA 2h, Douglas 14:32".
- The next shift (and anyone who opens the screen) sees the case is being handled and by whom.
- When the problem actually resolves, the alert closes on its own and leaves this page.
Resolved
You do nothing on the screen. When the alert definition stops being true (CPU back to normal, process up again), the alert closes automatically, leaves this page and shows up in History with total duration and reason for closing.
Best practices
A few simple rules that separate a team that operates well from a team that suffers with alerts:
Treat chronic alerts at the source
If an alert keeps firing and nobody acts, the problem is not the notification, it is the rule. Fix the source (wrong threshold, alert with no owner, missing dependency). Use History and the Recurring Alerts report to spot candidates.
Leave a note before you walk away
Before closing the tab or switching shifts, drop a note on the alerts you are working on. The next shift (or yourself 2 hours from now) will thank you.
Set up proper notification rules
The screen here is reactive: you open it when you need to look. The proactive flow is via notification rules: critical production alert lands on the on-call Slack, medium staging hits the team email. If everything is reaching the wrong NOC, the problem is not on this page, it is in the rules.
Watch out for stale Information alerts
Information-severity alerts that stay open for days indicate nobody treats them and they probably should not be alerting at all. Consider disabling the rule or downgrading to a plain metric, instead of letting noise accumulate.
Next steps
-
Alerts History
Alerts that already resolved. Use it to investigate chronic ones, build an incident report or measure MTTR.
-
Concepts
Full platform vocabulary: alert, severity, maintenance, notification rule.