Hosts
Central page to track and configure everything monitored as a host on the platform: Linux and Windows servers, containers, network devices, DCIM equipment, synthetic checks.
The page has two levels: the list with every host in the tenant and the detail for each one, with charts, processes, logs, alerts and configuration.
The list
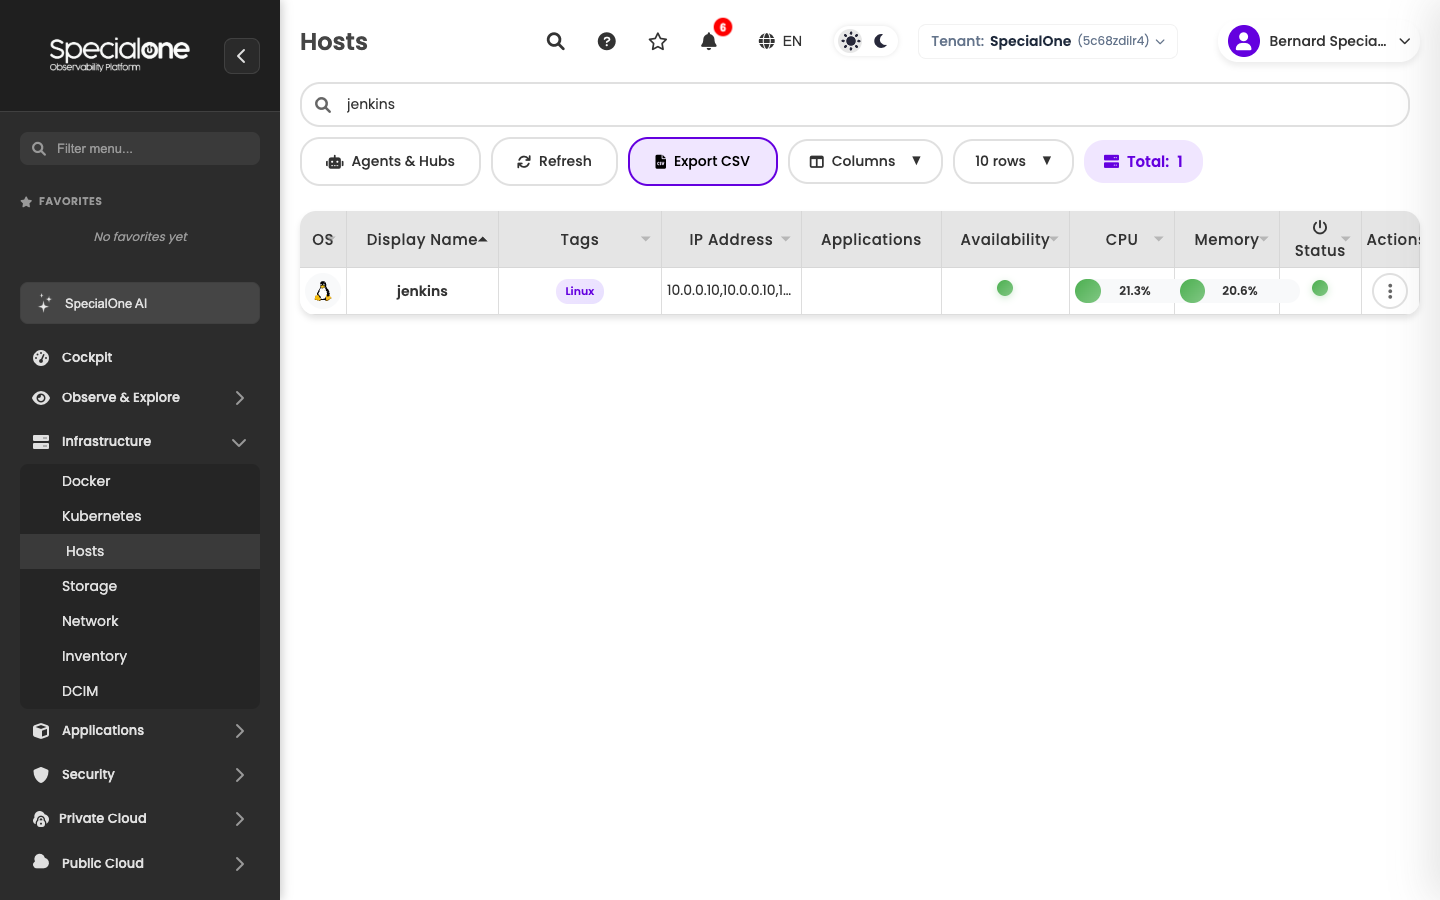
Accessed from Infrastructure → Hosts. Shows every host in the current tenant on a table with:
| Column | Content |
|---|---|
| OS | Operating system icon (Linux, Windows, etc). |
| Display Name | How the host appears on the platform. |
| Tags | Labels assigned to the host (free or inherited from a profile). Used in filters and notification rules. |
| IP Address | List of IPs bound to the host. |
| Applications | What applications are running, when informed. |
| Availability | Colored indicator (green/red) of the latest availability check. |
| CPU and Memory | Current usage in percentage. |
| Status | Consolidated overall state. |
| Actions | Three-dot menu with quick operations (edit, maintenance, remove). |
Above the table sit the controls:
- Search by name.
- Agents & Hubs: shortcut to the collector management page.
- Refresh: forces a reload of the data.
- Export CSV: downloads the current list.
- Columns: pick which ones show up.
- Rows per page and pagination at the bottom.
- Total: N on the right indicates the filtered total.
Use tags to find quickly
On environments with dozens or hundreds of hosts, standardize tags by area (infra, apm, db), environment (prod, staging) and customer. Tags show on the list and can be filtered, and they are the basis for routing in notification rules.
The host detail
Click a row to go to the host page. It is organized in five main tabs:
- Metrics (default): KPIs and charts.
- Processes: top processes on the host.
- Logs: integration with host logs, when configured.
- Alerts: open alerts on the host right now.
- Configuration: everything that defines how the host is monitored.
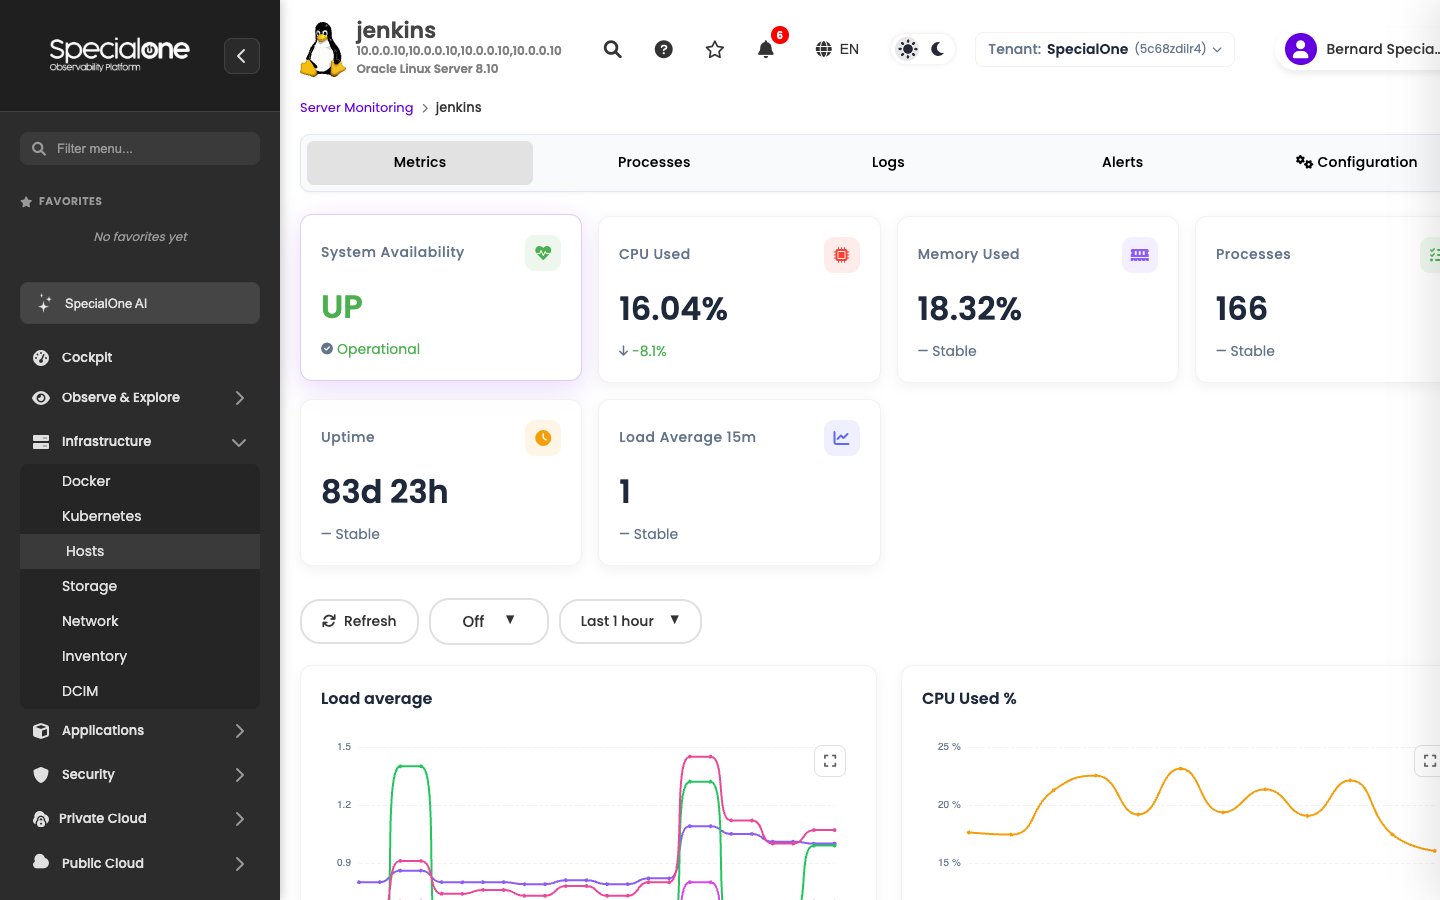
The Metrics tab brings:
- Host KPIs on top (Uptime, CPU, Memory, Disk, Load, Network).
- Period selector (default Last 1 hour; allows 24h, 7d, 30d or custom).
- Time-series charts for each key metric.
The breadcrumb on top (Server Monitoring › jenkins) takes you back to the list with one click.
Configuration tab
Configuration is where the host is defined: name, monitoring profiles applied, tags, variables and which alerts are active. It splits into three sub-tabs:
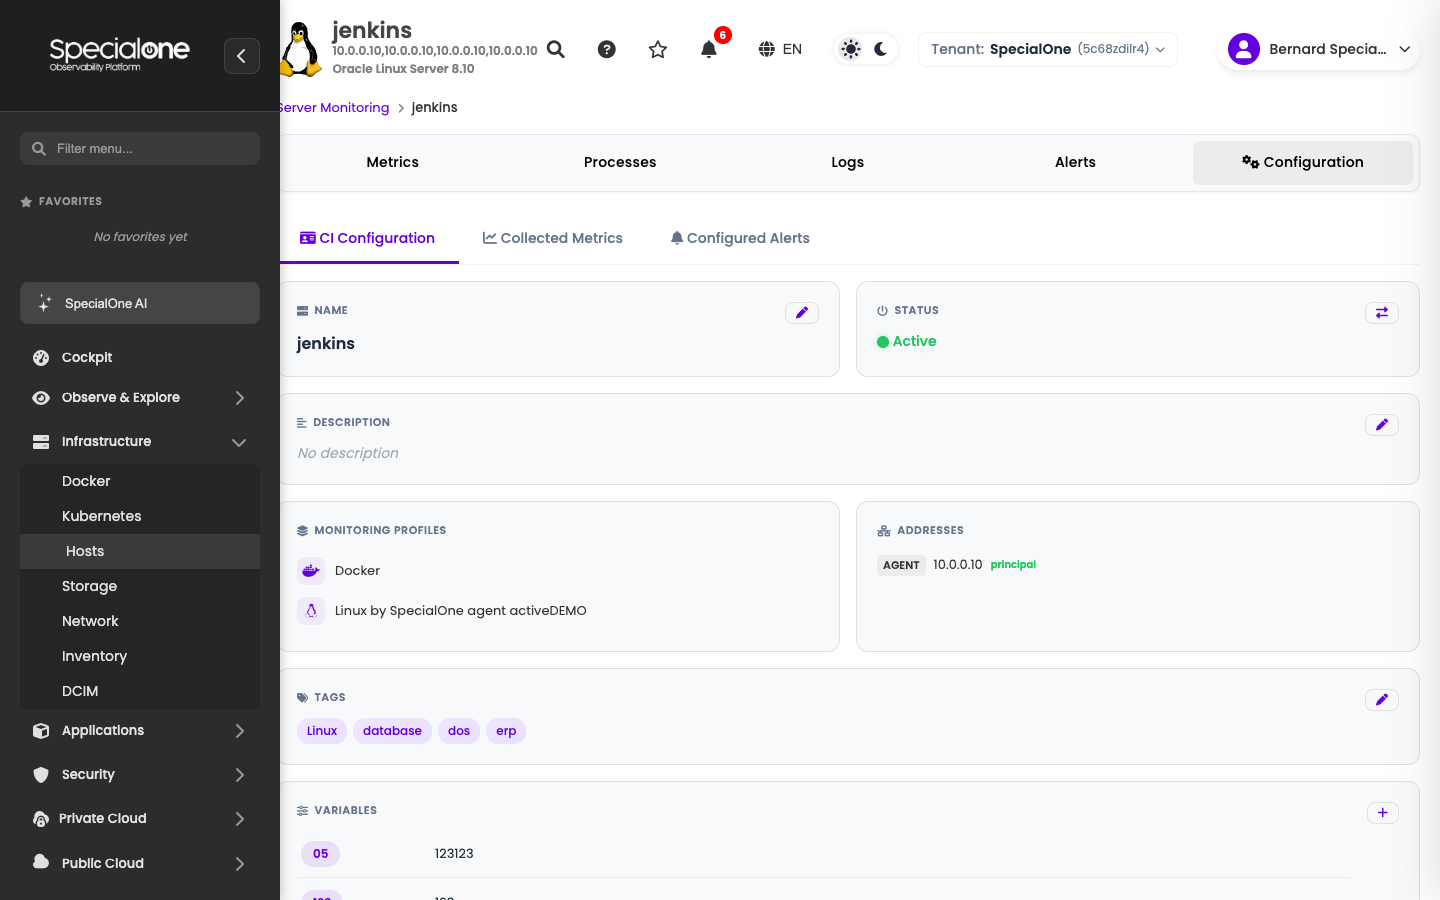
CI Configuration
The first sub-tab gathers the host attributes:
- Name and Status (active or paused).
- Free-form Description.
- Monitoring profiles: profiles applied to the host. Profiles are what bring standardized metrics and alerts in.
- Addresses: how the collector reaches the host (agent IP, port).
- Tags: visible here and on the list.
- Variables: key-value pairs that tune host behavior (specific thresholds, custom paths). Referenced inside profiles to avoid editing alert by alert.
Collected Metrics
List of metrics active on the host. Each row shows the metric name, collection interval, latest value and source (which profile contributed that metric).
Configured Alerts
The densest sub-tab: lists every alert configured on the host, whether inherited from a profile or created manually.
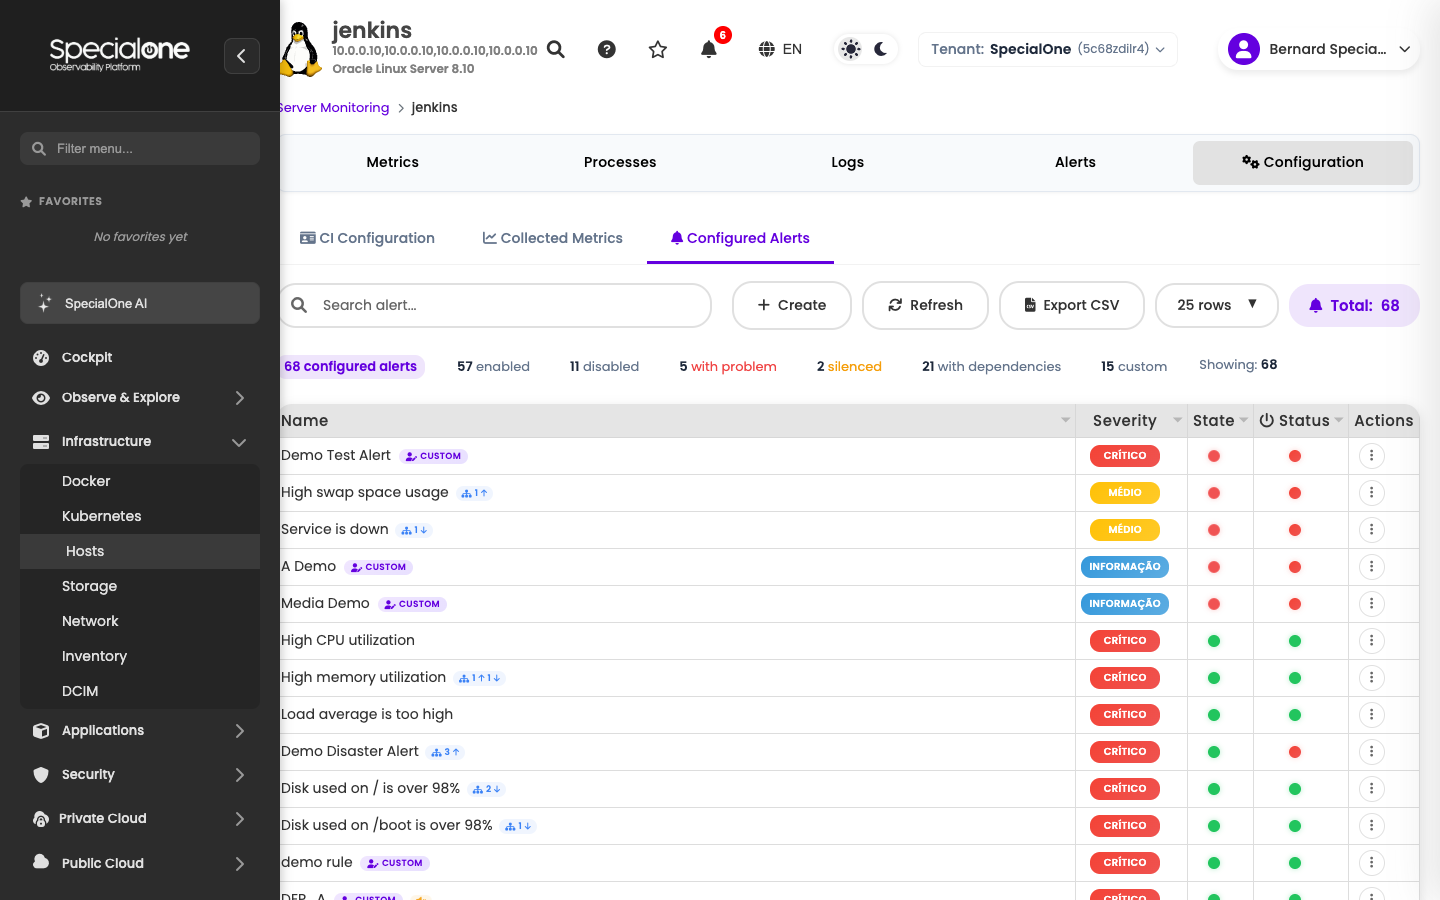
The counters on top help quick triage:
| Counter | What it counts |
|---|---|
| configured alerts | Total on the host. |
| enabled / disabled | How many are active versus paused. |
| with problem | Currently firing. |
| silenced | Suppressed by maintenance. |
| with dependencies | Waiting for another alert before firing. |
| custom | Local copies that diverged from the source profile (badge CUSTOM on the row). |
The table shows alert name, severity, state (enabled/disabled), status (firing now or not) and the actions menu.
Editing an alert on the host
This is where many people get confused. Clicking Edit on an alert listed in Configured Alerts, the platform warns explicitly:
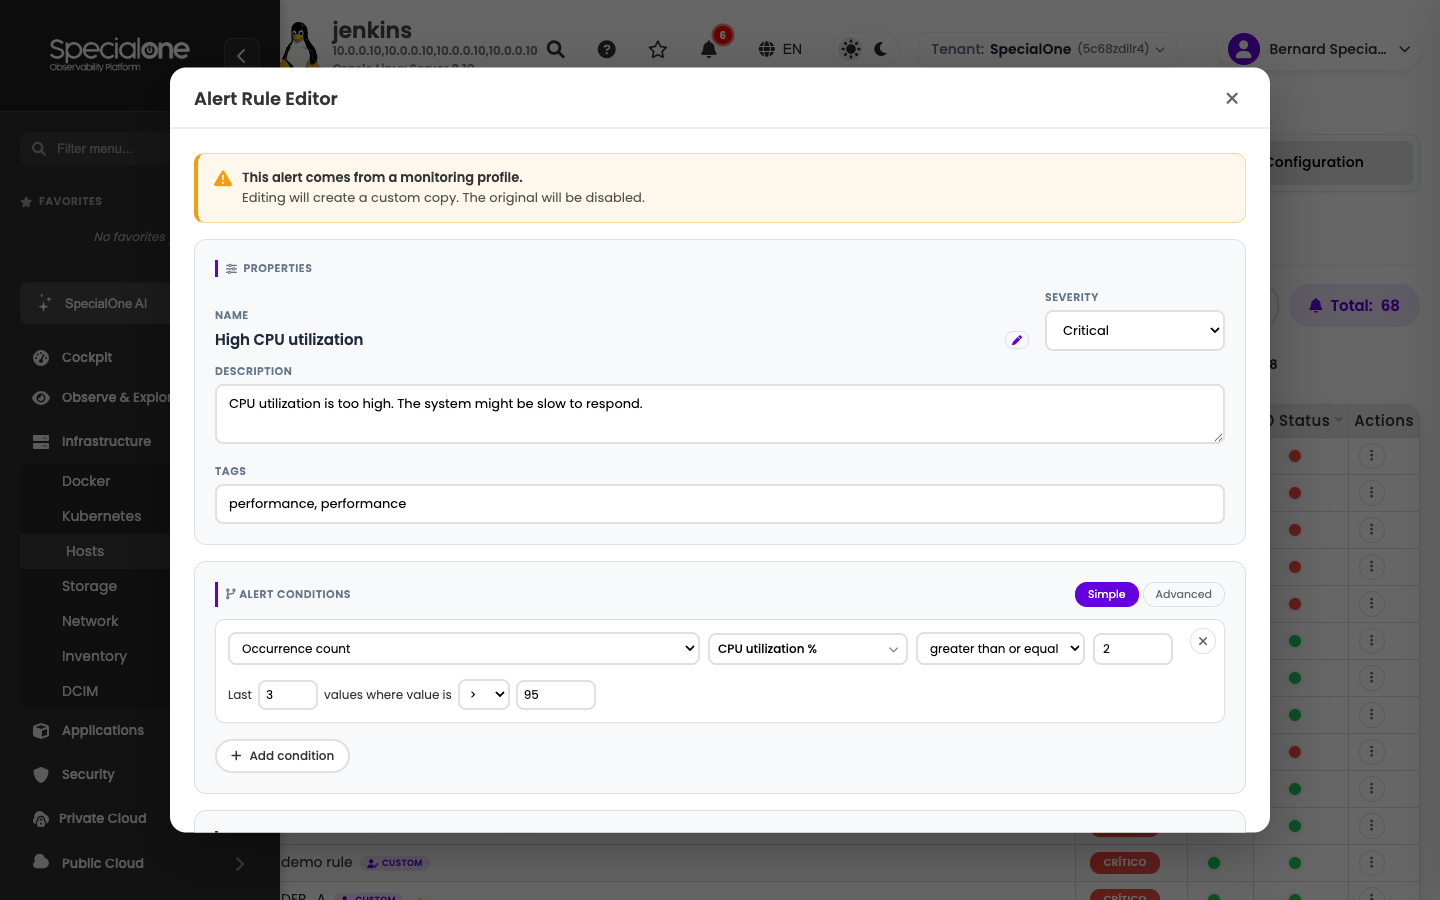
This alert comes from a monitoring profile. Editing will create a custom copy. The original will be disabled.
In other words: editing clones the profile definition into the host. Once you Save, the alert on that host becomes a custom version (badge CUSTOM appears on the row) and stops receiving updates from the profile when it evolves.
The trade-off is worth it when you need a targeted adjustment (e.g. raise the CPU threshold only on that host because it has a different nature). Worth flagging the long-term cost:
- If a profile improvement is published later, that host will not get it.
- The custom counter at the top of the sub-tab is the gauge of how much the host is drifting from the standard.
Before customizing, consider a host variable
Many alert thresholds are parameterized by variables in the CI Configuration sub-tab. Changing the variable (e.g. CPU_THRESHOLD) is better than cloning the alert: it adjusts behavior without breaking the link to the profile.
Editor structure
The alert rule editor has three blocks:
- Properties: name, severity (Information, Medium, High, Critical), description, tags.
- Alert conditions (mode Simple or Advanced): the formula that fires the alert. Simple mode combines metrics and operators in a form; advanced lets you write the expression directly.
- Actions (not in the print): enable/disable, dependencies, alert-specific notification rules.
Reverting to the profile
To roll a custom copy back to the original profile, delete the local version: it disappears from the host and the link to the profile is restored automatically. The custom counter drops and the host starts inheriting updates again.
Discovery
Before showing up in the list, a host usually goes through Discovery. The collector scans a network range (or another configured source), detects candidates and leaves them pending approval. After approval, the host enters the list and starts collecting per the applied profile(s).
Manually created hosts also appear in the list, but miss the benefit of having attributes auto-filled by discovery (IP, OS fingerprint).
Common operations
| Operation | Where |
|---|---|
| Apply maintenance (silence alerts for a period) | Actions menu on the list, Maintenance option. Or under Administration → Maintenances. |
| Pause collection on a host | Configuration → CI Configuration tab → switch Status to inactive. |
| Change monitoring profile | Same tab, Monitoring profiles card. |
| Add a brand new alert only on this host | Configured Alerts sub-tab → + Create. |
| Edit a threshold value used by a profile alert | Variables card on the CI Configuration sub-tab. |