Sharing and viewing
Once the dashboard is built, the game changes: you need to decide who sees it, who edits it and how it gets consumed day to day. This page covers three topics that travel together: dashboard visibility (sharing), the granular permissions that define who can touch what, and the view mode (the screen used to consume, with no editor distractions).
The three are intertwined. Changing visibility grants (or removes) access for other people. Each access level brings a different set of permissions. And the view mode is what those users actually open every day, with auto-refresh, time range and filters applied at runtime.
The four visibility levels
Every dashboard has exactly one level, picked by the owner at creation and adjustable later. Visibility shows up as a badge in the Visibility column on the dashboards list.
- Private: only the creator sees it. The default for new dashboards and the destination for copies created via Duplicate. Use for drafts, personal on-call screens, experiments.
- Organization: every user in the same tenant sees it. Use when the content makes sense for the whole operation: NOC panels, customer executive dashboards, screens that live on the wall TV.
- Shared (N): visible to a specific list of emails defined by the owner. The number in parentheses is the count of users on the list (for example, Shared (3) indicates three emails). Use when the content is only relevant to a group (a squad, a directorate, an internal customer).
- Public: visible to users of any tenant on the platform. Reserved for dashboards standardized by SpecialOne or by global administrators. Most users never touch this level.
How to change visibility
Visibility can only be changed by the owner of the dashboard. The path is the same as content editing:
- Open the dashboard in the editor (Edit Dashboard in the three-dot menu on the list, or Edit inside view mode).
- Locate the properties panel on the right.
- In the Visibility section, pick the desired level on the selector.
- When you pick Shared, an extra field appears for the email list. Use commas to separate (
john@company.com, jane@company.com). - Save.
The change is instant. Whoever loses access stops seeing the dashboard in their list on the next refresh; whoever gains it starts seeing it right away.
Visibility is not the same as publication
Even with Organization or Shared visibility, the dashboard still needs to be Published: Yes for recipients to see it. While not published, it behaves as Private. This separation is intentional: it gives you time to work on the draft calmly before releasing.
Granular permissions
Visibility defines who sees. Permissions define who edits. The platform has three effective permission levels per dashboard:
| Who | What they can edit | What they cannot |
|---|---|---|
| Owner | Everything: content (name, description, widgets, filters, layout), visibility, sharing list, publication, deletion. | Nothing (full control over the dashboard they created). |
| Shared user (email listed in Shared) | Content (name, description, widgets, filters, layout). | Visibility, sharing list, deletion. |
| Tenant collaborator (Organization or Public visibility, same tenant as owner) | Content (name, description, widgets, filters, layout). | Visibility, sharing list, deletion. |
The logic is simple: the owner is the only one who controls who comes in and who goes out, and the only one who can delete. Everyone else with access can adjust content, so the dashboard evolves collaboratively without spinning up a copy for every change.
Collaborative editing has no lock
When two people with edit permission open the same dashboard at the same time, the last to save wins. There is no locking and no version history. Coordinate with the team before touching heavily used dashboards, or prefer Duplicate for experiments.
When to duplicate instead of editing
If you are a collaborator (not the owner) and want to make significant changes to layout or metrics:
- Duplicate first (three-dot menu → Duplicate).
- The copy is born as Private, under your name.
- Iterate freely. Once you are satisfied, align with the original owner if it makes sense to apply back, or keep it as a standalone dashboard.
This routine avoids conflicts and protects the work of other people who depend on the original dashboard.
Adding specific users
To share with people who are not in your tenant or to grant pointed access without exposing to the whole organization, use Shared visibility:
- Open the dashboard in the editor.
- Change visibility to Shared.
- In the email field that appears, type the emails separated by commas:
dev@customer.com, ops@partner.com, manager@internal.com. - Save.
The listed users will see the dashboard on their own My Dashboards list, with a Shared (N) badge. They do not get an automatic notification about the sharing, so coordinate outside the platform.
Whoever enters the sharing list gains permission to edit content (not visibility). If you want to grant read-only access, today the alternative is to keep Organization visibility combined with publication for third parties via the dashboard menu, or set up a governance routine within the team.
For a whole team, use Organization
If the email list starts getting long (more than five or six people) and recipients are all in the same tenant, it is easier to switch to Organization and use tags or clear names so each team finds its own. Large Shared lists become hard to maintain.
Tags
Tags are the way to organize dashboards inside the tenant. Each dashboard can have any combination of free-form tags defined by the owner.
To add or edit tags:
- On the dashboards list, locate the dashboard row.
- Click Add Tags (or Edit Tags if it already has tags).
- In the modal, write the tags separated by commas:
analytics, reports, sales. - Click Save Tags.
Tags show as a badge on the row. The dashboards search on top of the list also looks into tags, so a dashboard with tag noc is found when you type "noc" in the search field.
Tags have a size limit
The tags field today is limited to 45 characters total, including separators. If you need many tags, prefer short combinations (infra, apm, db, prod) over phrases. This limit comes from the current database schema and may change in future versions.
Favoriting
Each row in the list has a star icon on the left. Clicking marks the dashboard as a favorite. The Favorites filter on top of the list shows only favorites.
Favorites help when you use many dashboards and want to reach your preferred ones quickly without searching by name.
Duplicating
The Duplicate action is in the three-dot menu of the row. When you click:
- A modal opens with the name field pre-filled as Dashboard Copy (or Original Name (Copy), depending on the version).
- Adjust the name if you want.
- Confirm.
The platform creates a new dashboard identical to the original, with every widget copied, same filters, same configurations. The only difference: the new dashboard visibility goes back to Private, under your name.
Common use cases:
- Test changes without affecting the original: duplicate, experiment, discard if it does not work.
- Start from a template: take a standard Organization dashboard and duplicate to customize for a specific customer or scenario.
- Content migration: duplicate before a major redesign, keep the original as an informal backup until the new version is validated.
The copy is independent from the original from the moment of creation. Later changes to the original do not reflect on the copy, and vice versa.
Deleting
The Delete action is also in the three-dot menu, available only to the owner. Collaborators and shared users do not see this option.
When clicked, a confirmation modal asks if you are sure. Confirm to delete.
Deletion is definitive. There is no trash bin or soft-delete: the dashboard disappears from the database, along with every widget and configuration. Whoever had it open on a tab starts getting errors.
Irreversible operation
Before deleting a dashboard with Organization, Shared or Public visibility, consider:
- Letting users know it is going away.
- Duplicate to your name as Private if you want to preserve the content in case of regret.
View mode
View mode is the screen used to consume the dashboard day to day. Unlike the editor (with widget palette, properties panel, snap grid), view is clean: only widgets and the essential controls.
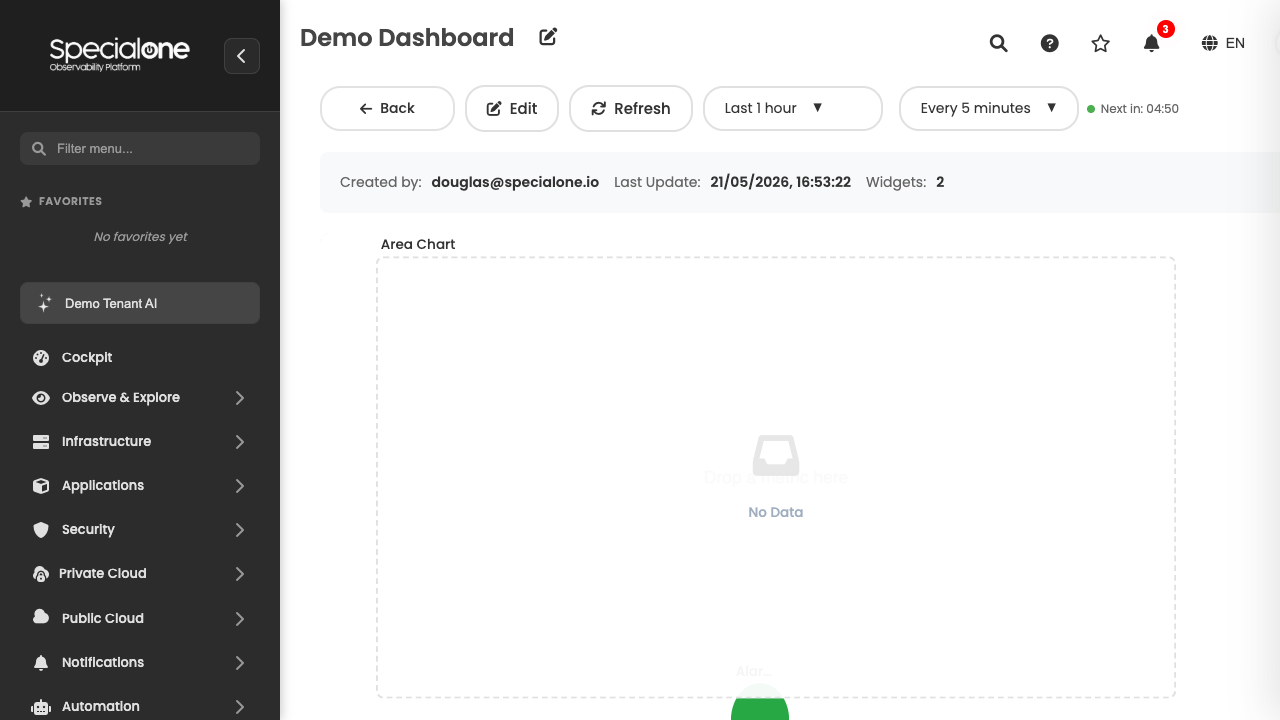
URL: /dashboard_view?id=X, where X is the dashboard identifier.
You land on view mode by clicking the dashboard name on the list, or by clicking Back inside the editor. It is also the shareable URL: anyone with access can open it directly if they receive the link.
What is available
| Control | Function |
|---|---|
| Back | Goes back to the My Dashboards list. |
| Edit | Opens the editor (Dashboard Designer). Only appears if the user has edit permission (owner, shared or tenant collaborator). |
| Edit dashboard name | Click directly on the title at the top to rename inline (owner only). |
| Time range | Range selector applied to all widgets that inherit from the dashboard. |
| Auto | Auto-refresh toggle. |
| Refresh | Manual refresh (reloads data of every widget now). |
| Add Widgets | Inserts pre-existing or new widgets without entering the editor. |
| Add Filter | Applies global filters at runtime. |
What is not available
In view mode you do not see:
- Widget palette on the left.
- Properties panel on the right.
- Snap grid or resize handles.
- Drag / resize buttons for individual widgets.
For any of those operations, click Edit and the platform opens the editor.
Auto-refresh
The Auto button on the top of the view toggles between off and a periodic refresh interval. When you pick an interval, the platform runs an automatic refresh every N minutes / hours, reloading the data of every widget that depends on time.
Available intervals:
- Off (default for freshly opened dashboards).
- Every 1 minute.
- Every 2 minutes.
- Every 5 minutes.
- Every 10 minutes.
- Every 15 minutes.
- Every 30 minutes.
- Every 1 hour.
- Every 2 hours.
- Every 3 hours.
- Every 4 hours.
Eleven options in total, counting Off. The choice is per user and per session: it is not persisted per dashboard, so each operator picks the cadence that makes sense for the task.
NOC dashboards on wall TVs
For panels that sit on large monitors for continuous monitoring, set auto-refresh to 1 to 5 minutes. More aggressive than that tends to overload the backend without practical gain, and less aggressive creates lag windows that confuse on-call operators.
Time range
The Time range selector on the top of the view defines the interval applied to every widget that inherits time from the dashboard (most widgets do, unless explicitly configured otherwise in the editor).
Fixed options:
- Last 1 hour.
- Last 3 hours.
- Last 6 hours.
- Last 12 hours.
- Last 24 hours.
- Last 7 days.
- Last 30 days.
Plus a Custom range option that opens a datepicker to pick start and end manually.
The choice is per session: when you reload the page the selector goes back to the default defined in the editor. Combine time range with auto-refresh to build the right experience: 1 hour + 1-minute refresh for live monitoring; 7 days with no auto-refresh for point-in-time analysis.
Adding widgets in view
Even in view mode you can insert widgets without opening the editor. The Add Widgets button on the top opens a modal with the available types (charts, tables, gauges, shapes, images, alarms).
The difference compared to the editor: in view the widget is inserted with automatic placement at the end of the canvas. To reposition and resize, you need to enter the editor.
It is the useful shortcut when the dashboard is open and you remember a metric you wanted to track, without losing the context of the screen.
Global filters at runtime
The Add Filter button lets you create filters that apply to every widget on the screen without opening the editor. They are session filters: not saved with the dashboard, valid only while the tab is open.
Common runtime filters:
- By host: focuses the dashboard on a specific host (or subset).
- By tag: filters widgets by hosts with a given tag.
- By application: restricts to a monitored application.
This turns a standard dashboard into an ad-hoc contextual dashboard. Example: you have an infrastructure health dashboard with 50 hosts. When an incident is identified, you apply a by host = srv-prd-15 runtime filter and the whole dashboard shows only that host, without touching the original.
Shareable URL
The view mode URL carries the dashboard identifier:
Any user with access to the dashboard (per the configured visibility) can open this URL directly. Paste it in chat, in email, in the incident description. Whoever does not have access gets an empty screen or permission error.
It is the fastest way to call someone in to look at the same panel as you. If the recipient is not in the visibility scope, adjust the Shared list or move up to Organization before sending.
Next steps
-
My Dashboards
Back to the main list: create, organize and open dashboards.
-
Widgets
Catalog of widget types (charts, tables, gauges, shapes) and how to configure each in the editor.