Alerts History
The Alerts History page lists alerts that have already been resolved, with start time, end time and duration. It serves post-fact analysis: measuring response time, investigating incidents, counting how many events happened in a period.
Alerts vs. History
It is worth separating the two screens clearly, because they live side by side in the Observe & Explore menu and tend to get confused on first read:
| Screen | Purpose | When to use |
|---|---|---|
| Alerts | Lists what is open right now, in real time. | Day-to-day operations: triage, response, leaving notes. |
| Alerts History | Lists what has already been resolved, with start and end timestamps. | Post-fact analysis: yesterday's incidents, monthly metrics, investigations. |
The rule is simple: if an alert is still firing, it shows up under Alerts. Once it resolves, it leaves that screen and lands in History.
How to open
From the side menu under Observe & Explore → Alerts History.
You also reach this page by drill-down from other screens:
- SLA Report, by clicking on a downtime event in the timeline.
- Recurring Alerts Report, by clicking on the count of a specific alert.
- Cockpit, in the recent alerts section.
In all those cases the page opens already with filters pre-applied (host, alert, period).
Page structure
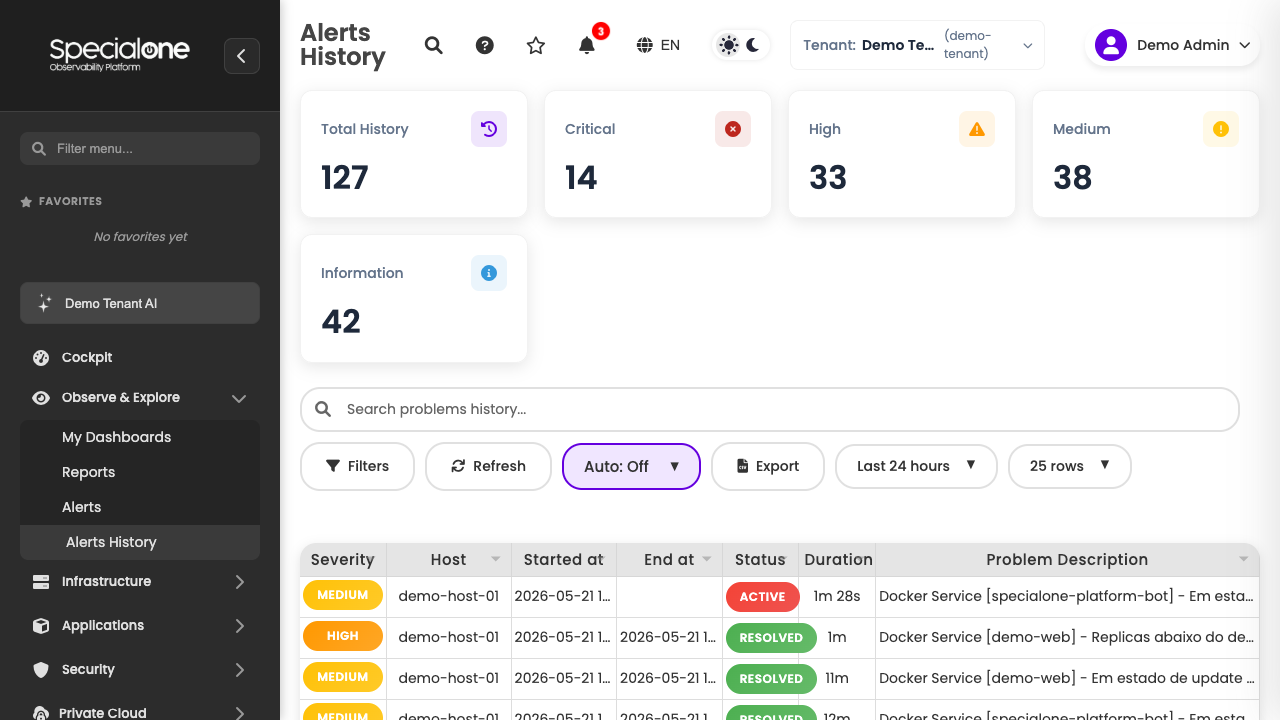
At the top:
- KPI cards with the count of resolved alerts by severity for the open period.
- Period selector in the header, with Last 24 hours as default, plus quick options and a custom range option.
- Shortcuts: Filters, Search, Refresh, Export, Columns.
In the body: the paginated table, with 25 rows by default.
The table
Each row represents an alert that was open and then resolved. Default columns:
| Column | Content |
|---|---|
| Severity | Colored badge: Critical, High, Medium or Information. Same scale as the Alerts screen. |
| Host | Affected host. Click goes to the host detail. |
| Started at | Timestamp when the alert opened. |
| Ended at | Timestamp when the alert resolved. |
| Status | Alert state in the slice: Resolved (already closed) or Active (still open, included because it started inside the period). |
| Duration | Total time between start and end. Computed automatically. |
| Problem Description | Name of the alert, as configured in the rule. |
Why Problem Description and not Alert Description?
The column label in the interface still reads Problem Description. Throughout the documentation we always treat it as alert, but we keep the exact column name so you can recognize it when looking at the screen.
Filters
The Filters panel opens as a drawer from the header button. Options:
- Period: two datepickers (start and end). The quick dropdown in the header is a shortcut to this filter.
- Hostname: field with autocomplete. Accepts wildcards (
*) to search host groups. - Tags (host and alert): combined by Any (OR) or All (AND). You add
key:valuepairs (e.g.,environment:prod,application:web). - Severity: checkboxes for Critical, High, Medium and Information. All checked by default.
- Free search: single field that matches host, alert and tags at the same time.
At the bottom of the panel: Clear All resets the state and Apply Filters confirms. The URL updates with the applied filters, which means sharing the link takes someone else to the same slice.
Share the slice
After filtering, copy the URL and send it to your team. Whoever opens it lands on exactly the same filters, no need to recreate the search manually.
Sorting
Click on a column header to cycle between ascending, descending and unsorted. Works on:
- Started at
- Ended at
- Duration
- Severity
- Host
- Status
Default sort is Started at, descending (most recent first).
Rows per page
The dropdown in the footer allows 25 (default), 50 or 100 rows per page. Pagination updates only the visible page, without re-running the full query.
Auto-refresh
Off by default in History. It makes sense: you are looking at alerts that already closed, so no real-time updates are expected.
If you do want it on (e.g., to watch incidents resolving over the morning), use the Auto toggle in the header and pick an interval. The available intervals follow the same pattern as the Alerts screen.
Export
The Export button offers three formats:
- CSV: for opening in a spreadsheet or processing in a script.
- Excel: pre-formatted with header.
- PDF: printable report, with tenant header and period.
In all cases the export respects current filters. If you filtered only Critical severity from the last month, the file comes out with only those rows.
10,000 record limit
The API truncates the result at 10,000 alerts. If your query exceeds that, the interface shows a notice asking you to refine your filters. Strategies:
- Reduce the period (e.g., look week by week instead of the whole month).
- Filter by severity (Critical and High only).
- Filter by a specific host or tag.
The limit also applies to export.
Alert detail
Click on a row in the table to expand the detail (or open it in a modal, depending on screen resolution). The detail panel shows:
- Tags of the host and of the alert.
- Messages recorded by the platform during the lifecycle (opening, severity changes, closing).
- Alert timeline: visual timeline with each event.
- Comments added by the team during response. They stay preserved after the alert resolves, and form the memory of the incident.
- View related alerts button: lists other firings of the same alert on the same host. Useful to understand whether it was an isolated event or recurring.
Use cases
How long did I take to resolve the last incident on host-X?
- Open the Filters panel.
- In Hostname, type
host-X. - Apply.
- Look at the Duration column on the most recent row.
How many alerts did we have in February?
- In the header, pick a custom period: Feb 1 00:00 to Feb 28 23:59.
- Apply.
- The KPI cards at the top show total count and breakdown by severity.
Investigate an incident from yesterday around 2 PM
- Period: yesterday from 1:30 PM to 4:00 PM.
- Filter by affected host, if known. Otherwise leave broad.
- Sort by Started at ascending.
- Walk through the sequence of events and open the detail on the relevant ones.
Which were the longest alerts of the month?
- Period: current month.
- Sort by Duration, descending.
- The top 10 or 20 are candidates for response process review.
For recurrence ranking, use the dedicated report
To answer "which alert fired the most this month", the shortcut is the Recurring Alerts Report, which already aggregates counts. History is better for analyzing individual events.
Limitations
Some details worth knowing before drawing hasty conclusions:
- Hard cap of 10,000 records per query. Already mentioned above. If you hit the limit and ignore the notice, your report ends up undersized.
- Timezone: all timestamps appear in your user's timezone (set under Administration → Users). When sharing a screenshot, remember that someone in another timezone will see different hours.
- No alert rule versioning: the name shown in the column is the current name. If you renamed the alert after the firing, history shows the new name, not what it was at the time. Same principle for severity, description and tags.
- Period filters by start, not by close: the slice filters on Started at. Alerts that opened during the period but did not close yet show up with status Active. If you want only the closed ones, sort by Status or look at the Ended at column.
Columns and customization
The Columns button above the table allows showing or hiding columns. The setting is saved per user. Useful when you always work with the same slice and want to simplify the view (e.g., hide Severity once you have filtered to Critical only).
Next steps
-
Alerts open now
The operational screen, real time, with alerts in progress.
-
Recurring Alerts
Ranking of alerts that fire most, to tackle chronic issues.
-
SLA Report
Consolidated availability, with drill-down into history events.
-
Hosts
A host's page includes an Alerts tab with the open ones and a link to filtered history.