My Dashboards
Personal and collaborative space to build your own views of the tenant. Unlike the Cockpit, which comes ready and shows aggregated tenant health, My Dashboards is fully customizable: you pick which widgets appear, with which metrics, in which layout and with which filters.
The main page lists every dashboard you can see (your own, the organization ones, those shared with you and the public ones). From there you create new ones, open existing ones for editing or viewing, organize with tags and adjust visibility.
Who uses it
- On-call operators build screens focused on what they need to watch on shift (a store, a cluster, a critical application).
- Managers create consolidated views with business KPIs crossed with infrastructure data.
- Specific teams (network, database, frontend) build thematic dashboards and share them with peers.
- Leadership opens public or organization dashboards to keep up with the big picture without having to build anything.
Creating does not require admin rights. Any user with tenant access can create and manage their own dashboards.
The list
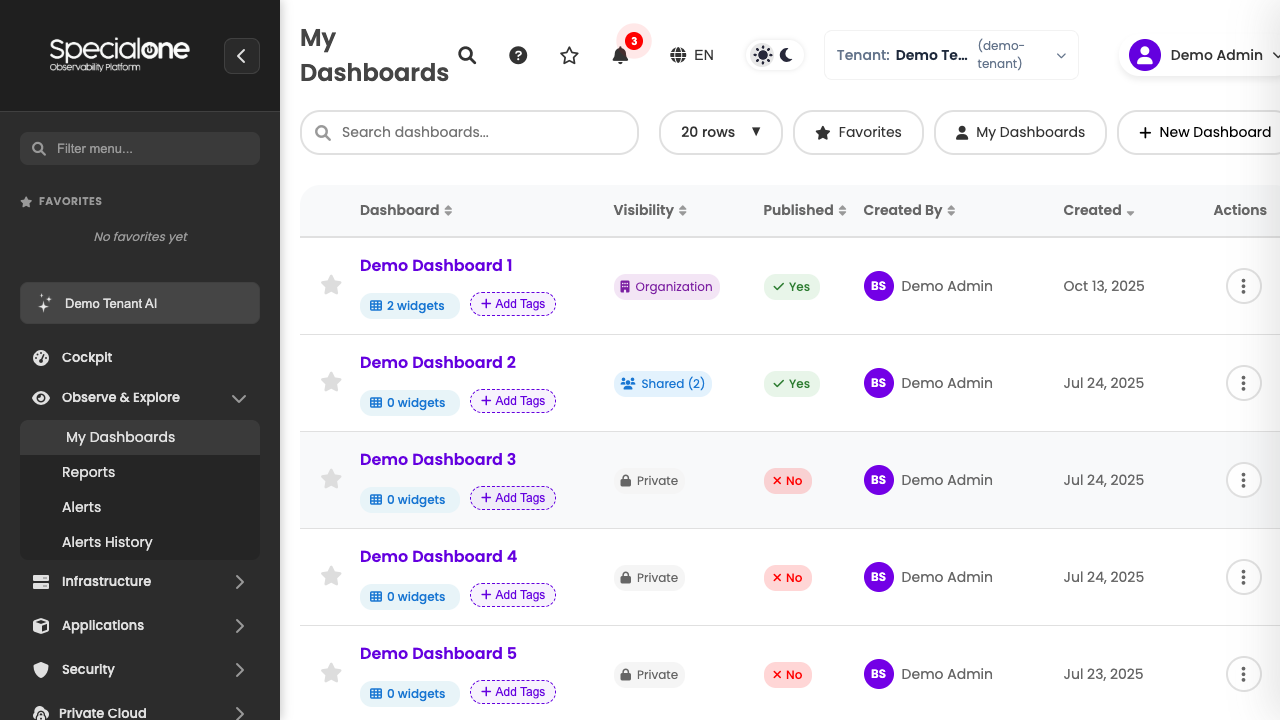
Accessed from Observe & Explore → My Dashboards. Shows every dashboard you have access to in the current tenant, on a table with:
| Column | Content |
|---|---|
| Dashboard | Dashboard name, with a N widgets badge indicating how many widgets it has. |
| Visibility | Who can see the dashboard (see types below). |
| Published | Badge Yes or No. Indicates whether the dashboard is available to the recipients of the configured visibility. A dashboard with Organization visibility but not published is only seen by the author. |
| Created By | User who created the dashboard. |
| Created | Creation date. |
| Actions | Star icon (favorite), Add Tags button and three-dot menu with Edit Dashboard, Duplicate and Delete. |
Above the table sit the search and filter controls, plus the New Dashboard button to create one from scratch.
Visibility types
Every dashboard has exactly one visibility level, picked at creation and adjustable later by the owner:
- Private: only the author sees it. Use for drafts, personal on-call screens, experiments.
- Organization: any user in the tenant sees it. Use for dashboards that make sense for the whole team.
- Shared (N): visible to the N users explicitly listed by the owner. Use when the content is relevant to a group only (a squad, an internal customer).
- Public: any user from any tenant sees it. Reserved for dashboards standardized by the platform or by global administrators.
Visibility is not the same as publication
A dashboard with Organization visibility still needs to be Published: Yes to actually show up for the other tenant users. While not published, it behaves as Private. That lets you work on the draft calmly before releasing it.
Search, filters and sorting
The header above the table brings:
- Search dashboards: filters the list by name substring in real time.
- Favorites: toggles the list to show only the dashboards you marked as favorite.
- My Dashboards (filter): restricts the list to dashboards you created. When combined with Favorites, it intersects the two.
- 20 rows (footer): selects how many items per page, with 10, 20, 50 and 100 options.
- Pagination: arrows on the edges when there are more pages.
Click any column header (Dashboard, Visibility, Published, Created By, Created) to sort ascending or descending. An arrow indicator shows next to the active column.
Row actions
Each row in the table brings three actions:
Star (favorite)
Click the star icon on the left of the row to mark or unmark the dashboard as a favorite. Favorites appear on top when the Favorites filter is on, and also in the side menu shortcuts when configured.
As noted above, favorite state lives on the browser.
Add Tags
The Add Tags button opens a modal with a free text field where you write the tags separated by commas (analytics, reports, sales). Tags are for your own internal organization, to group dashboards by theme or project. They show as badges on the list once configured.
When the dashboard already has tags, the button changes to Edit Tags and the modal comes pre-filled.
Three-dot menu
Opens the structural actions:
| Action | What it does |
|---|---|
| Edit Dashboard | Opens the editor (Dashboard Designer) on the same tab. The main path to change layout, add/remove widgets, tweak filters. |
| Duplicate | Opens a modal asking for the name of the new dashboard (default Dashboard Copy). Clones every widget and setting into a new dashboard with Private visibility. Useful to start from a known good base. |
| Delete | Removes the dashboard permanently, after confirmation. There is no trash bin: the operation cannot be undone. |
Before touching a shared dashboard, duplicate it
If you want to experiment with changes on an Organization or Shared dashboard, prefer Duplicate first. The copy starts as Private and gives you freedom to iterate without affecting whoever is using the original.
Empty state
If you have no visible dashboards yet, the table shows No dashboards found. Use the New Dashboard button on the top right to start. The same state appears when some filter (search, favorites, my dashboards) narrows the list to zero results, so it pays to check whether filters are active before assuming nothing has been created.
Next steps
-
Creating and editing
How to open the Dashboard Designer, pick visibility, set global filters and save.
-
Widgets
Catalog of available widget types (charts, tables, gauges, shapes, images) and how to configure each.
-
Sharing and viewing
View mode, auto-refresh, time range and sharing rules across users.