Databases
Inventory of databases monitored by the platform, with near real-time availability, summarized metrics (CPU, memory, connections) and correlated alerts. This is the DBA's and the production operator's screen: it answers fast questions like "is this database up?", "how many connections are open right now?" and "is this one inside a maintenance window?".
The page lives under Applications → Databases (URL /database-monitoring). Databases land here after being registered via the Add Database modal or brought in by the deployment team applying a monitoring profile to an existing host.
What belongs on this page
Databases registered with type and credentials for direct collection. Databases whose health is inferred only from the host OS (without instance credentials) stay in the Hosts inventory and do not show up here.
Supported types
The platform collects instance metrics from the four main relational engines:
- Oracle: connects via service name or SID. Collects active sessions, tablespaces, hit ratios, locks, wait events.
- SQL Server: connects via named instance or default. Collects sessions, locks, tempdb, indexes, SQL Agent jobs.
- PostgreSQL: connects on the default port (
5432) or a custom one. Collects sessions, table bloat, replication, locks, bgwriter. - MySQL: connects on the default port (
3306) or a custom one. Collects threads, buffer pool, replication, slow queries, locks.
Each type has its own icon in the DB column of the list, helping you eyeball and identify the fleet.
The list
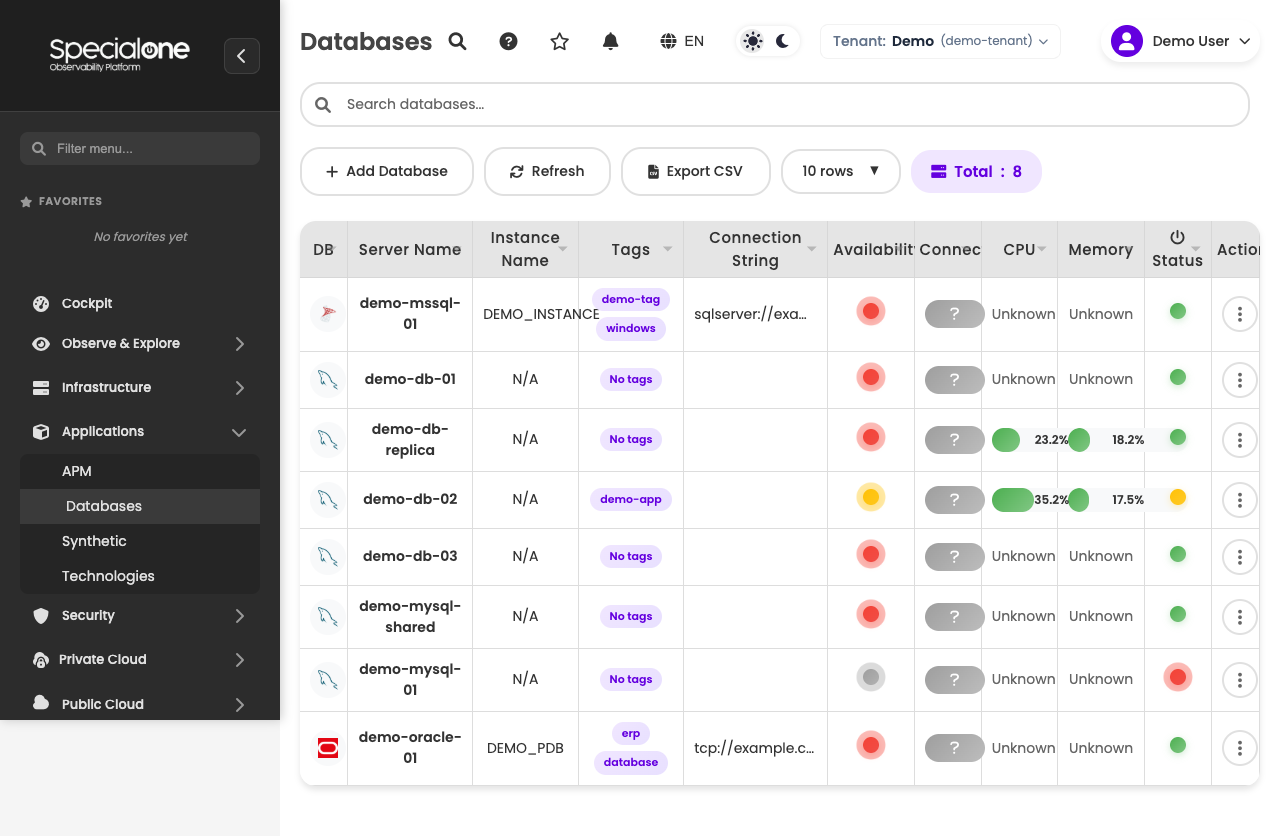
The table shows one row per instance. The columns:
| Column | Content |
|---|---|
| DB | Database type icon (Oracle, SQL Server, PostgreSQL, MySQL). |
| Server Name | How the server hosting the database appears on the platform (e.g. srv-postgres-app). |
| Instance Name | Identifier of the database instance running on top (e.g. db-prod-01). |
| Tags | Free-form labels used in filters and in notification rules. |
| Connection String | Full connection address, truncated on screen. Hover to see the complete string in the tooltip. |
| Availability | Status circle (green, red, orange, gray). Details below in Availability states. |
| Connections | Number of open connections at the moment of the last collection. |
| CPU | Colored progress bar with the server's CPU usage. |
| Memory | Colored progress bar with the server's memory usage. |
| Status | On/off icon indicating whether collection is active or paused. |
| Actions | Three-dot menu with per-row operations. |
Every column is sortable: click the header to toggle ascending and descending. Sorting happens on the server, so it stays correct even with a paginated result.
Top action bar
Above the table sit the standard page controls:
- Search: free-text filter across server name, instance name and tags.
- Add Database: opens the registration modal (next section).
- Refresh: forces a reload of the data.
- Export CSV: downloads the current list respecting filters and sort order.
- Rows per page: 5, 10, 25, 50 or 100.
- Total: N on the right shows the current filtered total.
Use tags to split environments
Standardize tags like env:prod, env:staging, engine:oracle, customer:name. These tags show on the list, feed filters and route notification rules. On fleets with dozens of instances, that is what separates a 30-second triage from a 5-minute one.
CPU and Memory bars
Bar color follows the usage band, calculated on the server hosting the instance:
| Band | Color | Reading |
|---|---|---|
| Below 70% | Green | Healthy. |
| 70% to 90% | Orange | Watch, monitor the trend. |
| Above 90% | Red | Saturation risk, action recommended. |
Values reflect the latest reading inside the last 2 hours. If collection is lagging (instance without valid credentials, collector offline), the bar shows the last known value and the Availability column turns gray.
Add a database
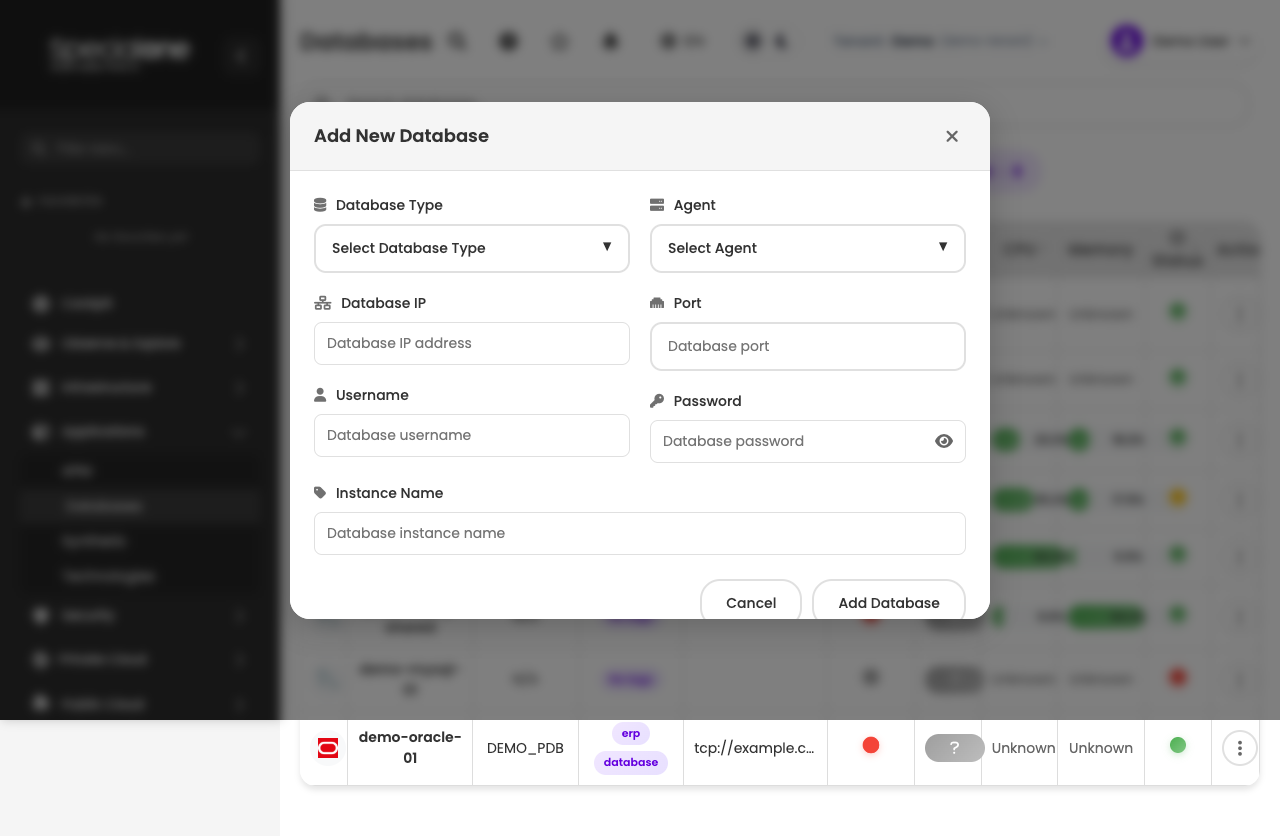
Click Add Database to open the registration modal. The fields:
| Field | Required | Note |
|---|---|---|
| Database Type | Yes | Oracle, SQL Server, PostgreSQL or MySQL. Drives which extra fields appear. |
| Database IP | Yes | Address reachable from the collector (e.g. 192.0.2.10). |
| Port | Yes | Listener port. Suggested per type (1521 Oracle, 1433 SQL Server, 5432 Postgres, 3306 MySQL). |
| User | Yes | Dedicated monitoring account, with minimal privileges (see tip below). |
| Password | Yes | Masked field with a show/hide button. Stored encrypted on the platform. |
| Collector | Yes | Dropdown with the collectors available on the tenant. Pick one that has a route to the database. |
| Instance Name | Yes | How the instance is going to appear on the list (e.g. db-prod-01). |
| Service Name | Oracle only | Oracle service name. Use this OR the SID, not both. |
| SID | Oracle only | Alternative to Service Name for older Oracle. |
On confirm, the platform:
- Validates that the collector can reach the informed IP and port.
- Tries to authenticate with the credentials.
- Creates the instance on the inventory and applies the default monitoring profile for the chosen type.
- Within a few minutes, the first metric reading starts to populate the list columns.
Use a dedicated monitoring account
Do not reuse the application user. Create an exclusive account for the platform with read-only permission on the required views/catalogs (on Oracle, SELECT_CATALOG_ROLE; on SQL Server, VIEW SERVER STATE; on Postgres, the pg_monitor role; on MySQL, SELECT on performance_schema and information_schema). It shrinks the risk surface and keeps audit clean.
Mind the firewall
The modal can only validate the credential if the port is open from the collector to the database. If validation fails, confirm the firewall rule before touching the user/password.
Edit and manage
The three-dot menu on the Actions column opens the per-row operations:
Edit Tags
Opens a modal with the current tag list. Add new ones, remove existing ones and save. Tags are free-form and can be referenced in list filters and in notification rules. Standardize across environments to actually get value out of filtering.
Schedule Maintenance
Opens a datepicker with start and end. During the informed window, alerts for that instance are suppressed and the availability circle goes orange on the list. Useful before patches, planned restart, version upgrade or hardware swap.
The maintenance created here is the same entity covered in Maintenance. You can review and extend the window from the global maintenances page.
Edit
Reopens the same modal used in Add Database, now with existing data. Use it to swap an expired credential, change collectors (e.g. when migrating a database between datacenters) or fix the instance name.
Editing does not reset the metric history: the database stays the same instance on the inventory. What changes is how it gets collected from there on.
Delete
Asks for confirmation before removing. Deletion removes the instance from the list, pauses collection and archives the metric history. Open alerts on the instance close automatically within a few minutes.
Deletion is final on the inventory
Historical data remains available for reports for as long as the tenant retention policy allows, but the instance is no longer monitored immediately. If the intent is just to pause (for example, the database is going away for a week), use Schedule Maintenance instead of deleting.
Availability states
The Availability column shows a colored circle with the consolidated reading from the last 2 hours:
| Color | Meaning |
|---|---|
| Green | Database answered the latest check and stayed stable through the window. |
| Red (with animated ripple) | Database is offline right now, or went down at some point in the last 2h and has not returned stably yet. |
| Orange | Database is inside a scheduled maintenance window. Alerts suppressed. |
| Gray | No recent data. Likely a collection issue (collector offline, invalid credential, blocked route). |
The ripple animation on red is there to catch the eye on NOC walls: even 3 meters away, you can see something is down.
Why 2 hours
The analysis window is long enough to tell a real outage from a transient spike (short restart, network glitch) without losing an event that happened while nobody was watching. If the database went down at 14:05 and came back at 14:08, at 14:30 the circle is still red, reminding the team to investigate the cause.
Limits
The page is optimized for typical inventories of hundreds of instances. Worth keeping in mind:
- Pagination: max 100 rows per page. Larger inventories fall into natural pagination.
- Search: linear on the server. Fluid performance up to around 1000 registered databases.
- Displayed metrics: reflect the last 2 hours. For broader historical analysis, open the server detail via the link on the Server Name column and use the Metrics tab charts with the period selector.
- API timeout: 30 seconds. Heavy collections on slow networks may show lagged readings until the next collection finishes.
Best practices
Dedicated account with minimum permissions
Worth repeating: never point monitoring at the application user or at an admin account. Dedicated account with read-only access on catalog views is the right standard, lowers risk and keeps the audit trail clean.
Schedule maintenance before the real window
If the team is restarting the database at 22:00, schedule maintenance starting 15 minutes earlier and ending 30 minutes after. It avoids firing critical alerts on the on-call team for something planned, and the record stays on the trail for audit.
Tags by environment, engine and customer
Combine env:prod, engine:postgres, customer:name from the moment you register. The three dimensions together enable precise notification rules (e.g. customer X's production Postgres lands on the DBA channel dedicated to that customer) without enumerating instance by instance.
Next steps
-
Open alerts
When a database raises an alert, it shows under Observe & Explore → Alerts with severity, affected host and time open.
-
Hosts
The server hosting the database keeps appearing on the Hosts inventory, with OS metrics, processes and logs.
-
Concepts
Full vocabulary: monitoring profile, maintenance, notification rule.