Docker
Dedicated page to track Docker hosts: standalone nodes, swarms and any server where the Docker engine is what matters to observe. Covers engine state, running containers, local images and host resource usage.
Conceptually it is a specialization of the Hosts page: navigation, the Configuration tab and the Alerts tab work exactly the same. What changes is the content of the Metrics tab and the addition of a dedicated Containers tab.
The list
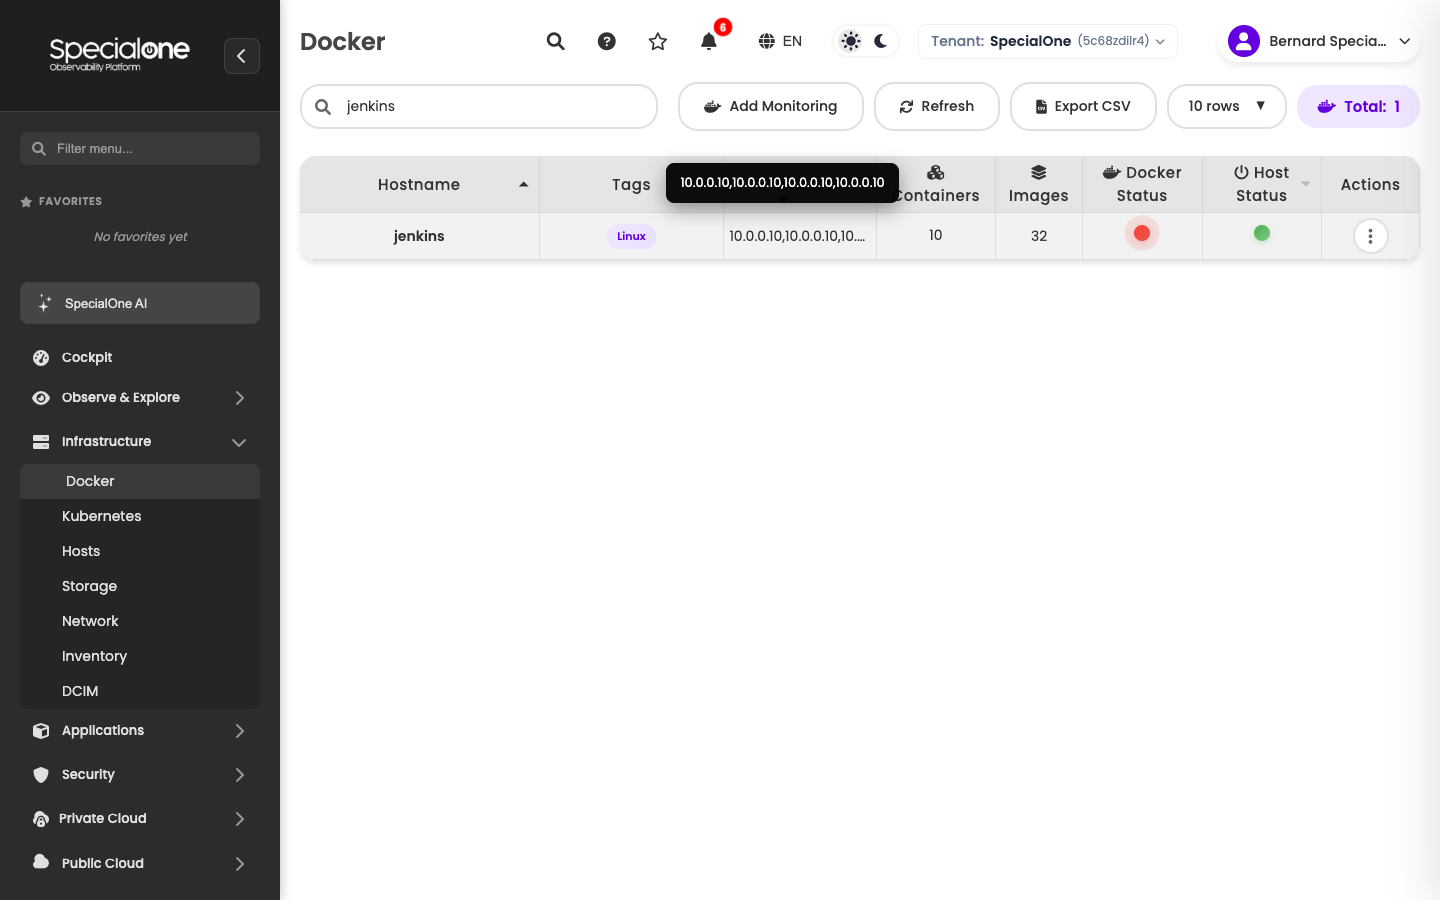
Reached from Infrastructure → Docker. Shows hosts where the Docker engine is being monitored, with its own columns:
| Column | What it shows |
|---|---|
| Hostname | Host name. |
| Tags | Labels attached to the host. |
| IP Address | IP of the agent collecting from this host. |
| Containers | Total containers on the host. |
| Images | Total images in the local registry. |
| Docker Status | Docker engine health (green = up). |
| Host Status | OS health on the same machine. |
| Actions | Three-dot menu with quick operations. |
Above the table sit the standard controls (search, refresh, export CSV, pick columns, pagination) and the Add Monitoring button, the entry point to enable Docker monitoring on a new host (see Enable Docker monitoring on a host).
Two statuses in the same row
Docker Status and Host Status are different signals. The Docker engine can be down on a server that is otherwise healthy (and the other way around). Splitting them helps you diagnose faster.
Enable Docker monitoring on a host
The Docker page does not register new hosts. It works on top of hosts the platform already sees. The flow has two stages:
Stage 1: the host must exist in Hosts
Before showing up here, the server needs to be:
- Registered in Hosts (via Discovery or manually added).
- With an active agent collecting operating system metrics. Confirm under Infrastructure → Hosts that the host is on the list and the Availability column is green.
- With Docker engine running and reachable by the agent on that machine. The agent is what talks to the local Docker socket, so the engine must be installed and active.
If any of these is missing, start with the Hosts page or with the agent installation docs before continuing.
Stage 2: apply the Docker profile
With the host ready:
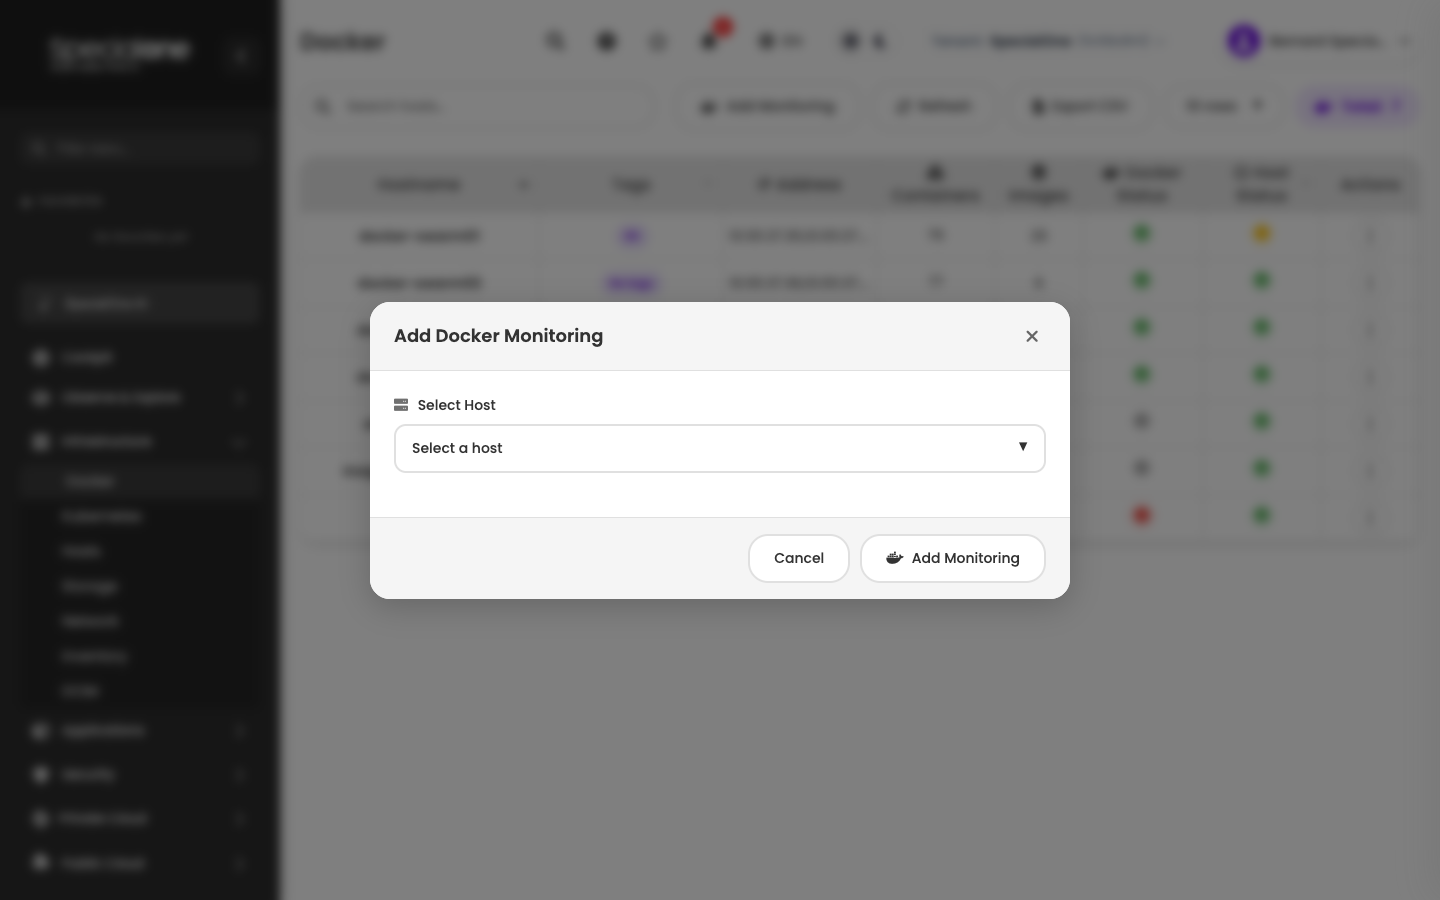
- Go to Infrastructure → Docker.
- Click Add Monitoring at the top.
- In the Select Host dropdown, pick one of the hosts listed. The dropdown shows only hosts that do not yet have the Docker profile applied, so a host already monitored as Docker will not appear here.
- Click Add Monitoring.
The platform applies the Docker profile to the host. Within minutes collection starts and the host shows up on the Docker page with Containers, Images and Docker Status columns populated.
Host missing from the dropdown
Two common reasons: either it is not yet in the Hosts page (go back to stage 1), or it already has the Docker profile applied. Check on the Hosts page → CI Configuration tab → Monitoring profiles card whether a Docker profile is already listed.
The Docker host detail
Click a row to open the detail. It is organized in four tabs:
- Metrics (default): engine-specific KPIs and charts.
- Containers: lists of containers and images on the host.
- Alerts: open alerts on the host right now.
- Configuration: identical to Hosts → Configuration.
Metrics tab
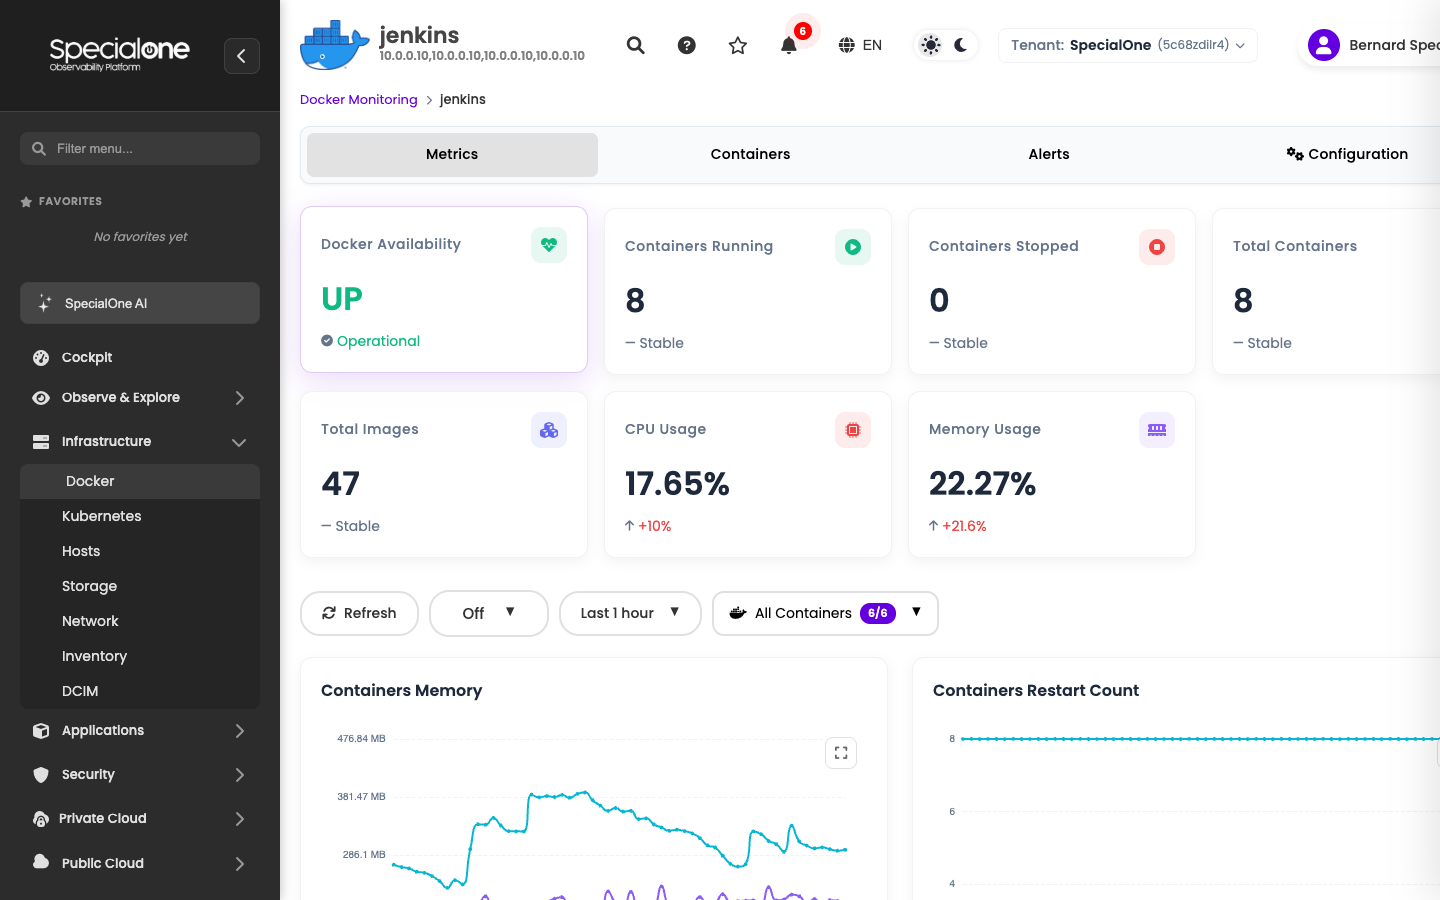
The KPIs on top are designed for Docker:
- Docker Availability: engine state (Up / Down).
- Containers Running / Containers Stopped / Total Containers.
- Total Images stored locally.
- CPU Usage and Memory Usage for the whole host, with trend indicator.
Below the KPIs sit filters (refresh, default 1h window, "All Containers" selector with paging) and per-container charts like Containers Memory and Containers Restart Count. Each series is one container or service, so the reading is "which container is using most resources" and "which is restarting too often".
Containers tab
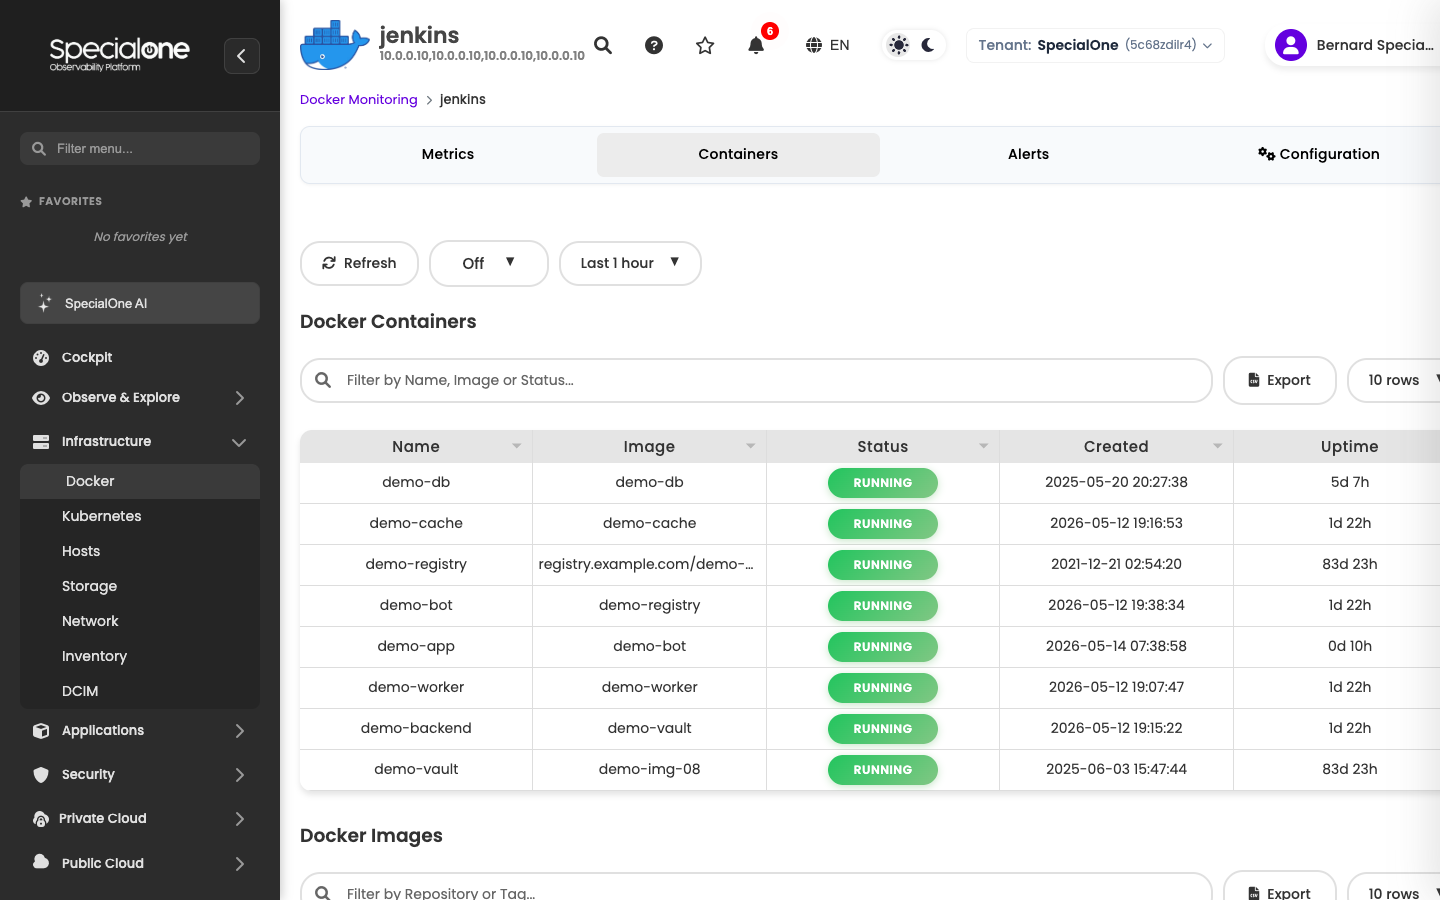
Two lists side by side:
- Docker Containers: name, image, status, creation and uptime per active container. On Swarm Manager hosts the list may show empty because containers are spread across worker nodes.
- Docker Images: repository, tag, size and creation date of each image stored locally. Useful to spot how much disk an outdated image is eating.
Each list has its own search, export and pagination.
Alerts and Configuration tabs
These follow the same model as on any other host. Instead of repeating, refer to the Hosts page:
- Configuration tab: host attributes, applied monitoring profiles, collected metrics and configured alerts.
- Editing an alert on the host: how the custom copy works when you edit a profile-inherited alert.
The practical difference is just the name of the applied profile, which typically covers Docker engine signals (containers, restarts, images) instead of pure OS metrics.
Docker Swarm
On Swarm environments monitoring brings a few extra signals that usually arrive as alerts configured by the profile:
- Replicas below desired: a service with fewer containers than the
replicas: Ndefined. - Service stuck in update state: rollout left partially applied.
- Node out of quorum: a manager lost contact with the majority.
These show up in the Alerts tab on the detail and on the Cockpit when recurrent.
Next steps
-
Other hosts
Linux, Windows and other resources share the same navigation and configuration model.
-
Kubernetes
For Kubernetes clusters monitoring is per cluster, not per node. See the dedicated page.