Synthetic
Page dedicated to synthetic monitoring: the platform runs active checks (HTTP, ICMP, TCP, UDP) against your tenant's URLs and IPs from collectors installed at different points in the network and cloud. The viewpoint is that of an external user: you find out the site is down or the SSL certificate is about to expire before the customer complains.
Unlike the other Infrastructure pages, the object monitored here is not a server or device: it is a URL/IP from the outside in. Each check is called a monitor and has a name, a target, an interval and success rules.
When it makes sense
Use a synthetic monitor whenever what matters to the business is what the end customer sees: e-commerce site up, public API responding, SSL certificate valid, network route leaving the datacenter. Synthetic complements server monitoring, it does not replace it.
Access from Applications → Synthetic.
Who uses it
- SRE and Platform Engineering: external availability of critical services, SLA targets.
- Customer support: quickly confirm whether a reported problem is general or isolated.
- Product team: track the health of public endpoints during launches.
The page is intentionally simple: ops needs to create and review monitors fast, without getting lost in sub-tabs.
The list
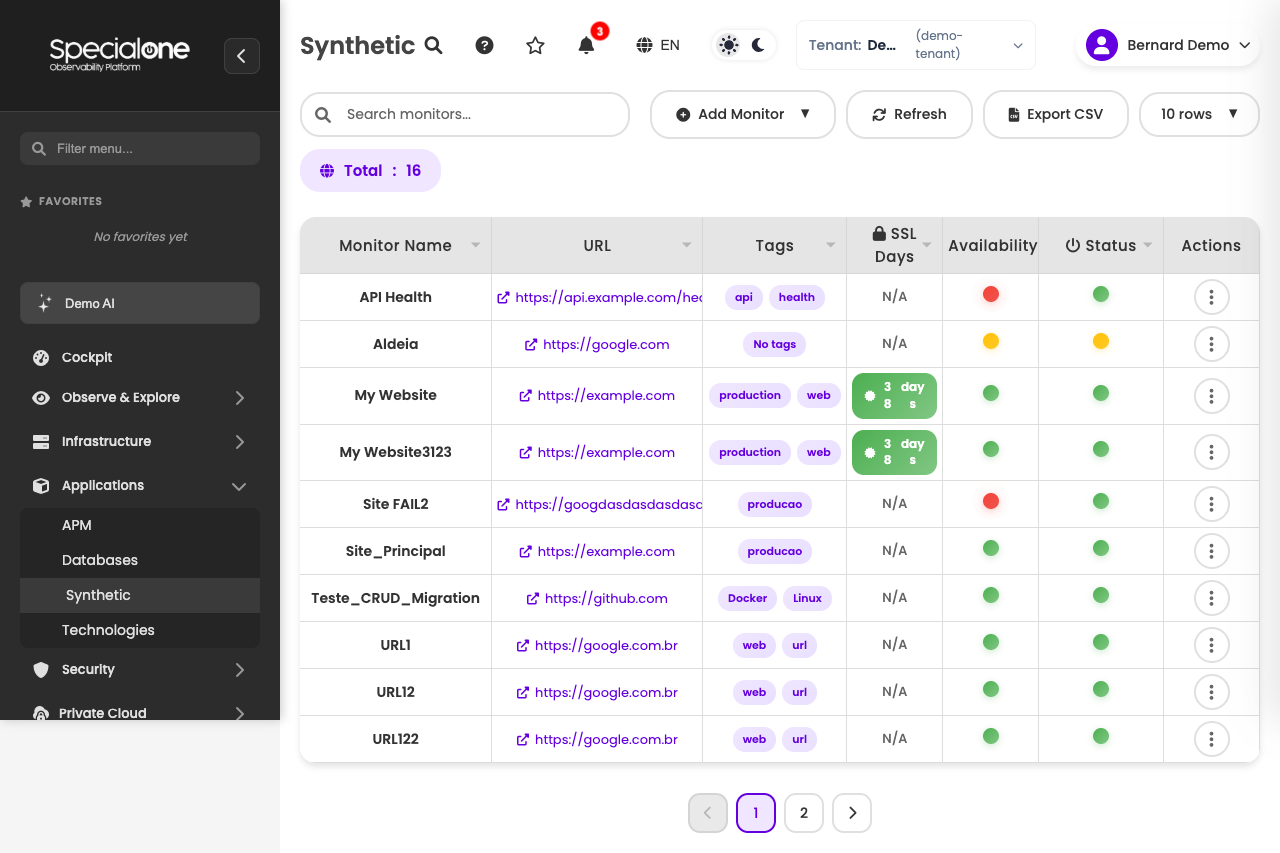
The main table lists every monitor in the current tenant. The columns:
| Column | Content |
|---|---|
| Monitor Name | How the monitor appears on the platform (e.g. Public API, Marketing Site). Sortable. |
| URL | Check target. For HTTP, the full URL; for ICMP/TCP/UDP, the host or IP. |
| Tags | Free labels (prod, customer-x, api, landing). Basis for filters and notification rules. |
| SSL Days | How many days remain until the HTTPS certificate expires, when SSL monitoring is on. Empty for plain HTTP or non-HTTP types. |
| Availability | Colored circle with the result of the last check. |
| Status | On/off icon indicating whether the monitor is active or paused. |
| Actions | Three-dot menu with quick operations (edit, enable/disable, tags, maintenance, delete). |
Above the table sit the standard platform controls:
- Search by name or URL (real-time filter).
- Add Monitor (dropdown with Single monitor and Bulk import (CSV)).
- Refresh: forces a data reload.
- Export CSV: downloads the current list according to filters.
- Rows per page (5, 10, 25, 50, 100).
- Total: N on the right shows the filtered total.
Availability colors
The circle in the Availability column follows the platform's visual convention:
| Color | Meaning |
|---|---|
| Green | Last check passed. |
| Red (with ripple animation) | Last check failed. The ripple helps catch attention on the NOC wall. |
| Orange | Monitor in maintenance (silenced). |
| Gray | No recent data (newly created monitor, collector offline or no valid collection). |
SSL Days colors
The SSL Days column colors the value according to how close the certificate is to expiring:
| Color | Window | When it shows |
|---|---|---|
| Green | More than 30 days | Normal life. |
| Orange | 7 to 30 days | Start of the renewal window. Time to open the ticket. |
| Red | Less than 7 days | Critical: renew immediately or the end customer will see an SSL error. |
SSL monitor is free and almost painless
Turn on Monitor SSL on every HTTPS monitor. The cost of finding out about an expiring certificate 30 days in advance is zero. The cost of finding out about an expired one in production is high.
Monitor types
The platform supports four kinds of active check. Each has its purpose:
| Type | What it does | When to use |
|---|---|---|
| HTTP | Performs a GET (or another method) on the URL and checks the response code. Supports status code validation, SSL monitoring and response time. | Sites, APIs, REST endpoints, application health checks. |
| ICMP | Ping to the destination host. Measures basic layer-3 availability and latency. | Basic connectivity with IPs, gateways, equipment without HTTP. |
| TCP | Tries to open a TCP connection on the given port. Confirms the service accepts the connection (but does not validate application response). | Databases, brokers, any service with a known port (MySQL 3306, Redis 6379, SMTP 25). |
| UDP | Sends a UDP packet. Useful for services without TCP (DNS, NTP, syslog), but the semantics are fragile because UDP does not confirm delivery. | DNS resolvers, NTP, specific UDP services with a known handshake. |
The majority of production monitors are HTTP. ICMP comes in as a fallback or as an extra validation layer for critical targets.
Add a monitor
The most common path is to add a single monitor through the form. For many at once, there is bulk import via CSV.
Path 1: Single monitor
- Click Add Monitor → Single monitor.
- Fill the fields:
- Monitor Name: visible identifier on the list (e.g.
Production Public API). - URL: target. For HTTP, the full URL (
https://api.example.com/health); for ICMP/TCP/UDP, the host or IP (example.com,192.0.2.10). - Type: HTTP, ICMP, TCP or UDP.
- Check Interval: 1 min, 5 min, 10 min, 30 min or 1 h. The shorter the interval, the sooner you notice a failure, the more load on the collector and on the target.
- Expected HTTP code (HTTP only): the status considered successful (200, 201, 301, 302, etc). Anything different counts as a failure.
- Monitor SSL (checkbox, HTTP/HTTPS only): when checked, unlocks the SSL port field (443 by default) and enables the SSL Days calculation on the list.
- Collector: dropdown with the available collectors. Includes the default cloud collector SpecialOne default cloud collector and any local collectors the tenant has installed.
- Monitor Name: visible identifier on the list (e.g.
- Click Save.
The monitor shows up on the list immediately. The first check happens within one interval: if it passes, Availability turns green; if it fails, red.
Short interval costs collection
Do not set 1 minute as the default for everything. Reserve the most aggressive interval (1 or 5 min) for business-critical targets (checkout, login, billing API). For secondary pages, 10 or 30 min is usually enough.
Path 2: Bulk import
To bring in many monitors at once (new customer onboarding, migration from another tool, URL inventory in a spreadsheet), use Add Monitor → Bulk import (CSV).
The modal accepts a CSV file with one line per monitor. The columns follow the same fields as the individual form (name, URL, type, interval, expected HTTP code, monitor SSL, collector, tags).
The platform runs upfront validation before saving:
- Invalid URL: line rejected with reason (malformed format, unsupported scheme).
- Duplicate URL: if a monitor with the same URL already exists in the tenant, or if the CSV itself has internal duplicates, the platform flags it.
- Unknown type or interval outside accepted values: rejection with a specific message.
The import is transactional: either all valid lines come in together, or none does. You do not end up with half an import because of one bad URL.
Start with 5 lines to validate the template
Before throwing in a 200-line CSV, import 5 to confirm the format matches what the platform expects. Adjusting 200 lines because the tag column used the wrong separator is avoidable pain.
SSL monitoring
For HTTPS monitors with Monitor SSL on, the platform queries the certificate on every check and calculates how many days remain until expiration. That information shows up in two ways:
- In the SSL Days column on the list, with the color described in the SSL Days colors section above.
- As an automatic alert when the value enters the orange (≤ 30 days) or red (≤ 7 days) window. These alerts follow the standard notification rules flow.
Combine that with the rule "every HTTPS monitor has Monitor SSL on by default". Certificate monitoring is one of the few checks where the alert signal arrives weeks ahead of the problem, giving you time to renew without pressure.
Watch out for internal certificates
The SSL monitor needs the collector to trust the target's certificate chain. If the internal certificate is issued by a private CA, the collector may flag it as invalid (not expired, invalid) and the monitor turns red. For those cases, use a local collector with the private CA configured as trusted, instead of the default cloud collector.
Collectors and locations
Each monitor runs on a collector. The collector choice defines where the check leaves from, which directly affects what it is actually measuring.
SpecialOne default cloud collector
The tenant ships with a collector pre-configured in SpecialOne's cloud, ideal for checking publicly exposed services as seen from the public internet.
Use the cloud collector when:
- The target is a public URL (site, API exposed on the internet).
- You want to measure what the external customer sees.
- There is no network restriction for the access (no firewall blocking unknown sources).
Local collectors
Tenants can install additional collectors inside their own network (datacenter, office, private cloud). These collectors run the same monitor types, but from inside the customer's network.
Use a local collector when:
- The target is on a private network (intranet, internal API, database in a restricted VLAN).
- You want to measure the experience of someone inside the network (branch validating ERP, office reaching internal portal).
- A firewall blocks external access and the service only responds to internal IPs.
Collector setup and management lives in Agents & Hubs. One local collector covers many monitors: install once, reference it in the Collector field of the monitors.
Multi-location for critical targets
For high-criticality services (e-commerce, login), consider monitoring the same URL from two or three collectors at different points (cloud, datacenter, another region). If the cloud monitor goes red but the local one stays green, the problem is routing; if both go red, the target itself is the issue.
Edit and manage
The Actions menu on each table row brings the day-to-day operations:
| Action | What it does |
|---|---|
| Edit | Reopens the single-monitor modal with fields populated. Edit what you need and save. |
| Enable / Disable | Pauses or resumes collection without deleting the monitor. Useful to suspend checks during a planned migration. |
| Edit Tags | Opens a dedicated modal to adjust tags only (free text, comma as separator). |
| Schedule Maintenance | Modal with a start/end datepicker. During the window, the monitor turns orange and its alerts are silenced (see maintenance). |
| Delete | Removes the monitor and its history. Confirmation required. |
Maintenance is the recommended path when you know the target will be down on purpose (deploy, IP change, DNS migration). Instead of disabling the monitor (and risking forgetting to re-enable), schedule the window: the monitor resumes collection and alerting by itself after the end.
Limits
Operational limits for the page:
| Limit | Value |
|---|---|
| Rows per page on the list | 5, 10, 25, 50 or 100 |
| URL length | 255 characters |
| Minimum interval between checks | 60 seconds (1 min) |
| Page API call timeout | 30 seconds |
| Supported monitor types | HTTP, ICMP, TCP, UDP |
| Accepted expected HTTP codes | any valid status (200, 301, 302, 401, 404, 503, etc) |
Larger monitor volumes (hundreds to thousands) are supported, pagination handles the rendering. For dense inventories, standardize area tags to filter quickly.
Best practices
A few simple rules that separate useful synthetic monitoring from noise:
Short interval only for the critical stuff
Reserve 1 or 5 minute intervals for what actually matters to the business (checkout, login, payments API, marketing site during business hours). The rest lives fine with 10 or 30 minutes. Short intervals cost collection on both the collector and the target.
SSL monitor on every HTTPS
Turn on Monitor SSL for every HTTPS monitor. It costs nothing and gives you a 30-day heads-up before the certificate expires.
Tag by area from the very first monitor
Standardize tags by area (api, landing, checkout), environment (prod, staging) and customer (customer-x) from the moment of creation. That pays dividends when filtering the list, exporting reports and setting up specific notification rules for each monitor type.
Next steps
-
Open alerts
When a synthetic monitor fails, the alert shows up on the main operational screen.
-
Agents & Hubs
Install and manage the collectors that run the checks.
-
Inventory
Consolidated view of every monitored category, including "URL Monitoring".