Audit Trail
The Audit Trail records who did what on the platform. Every relevant action (create a host, edit a rule, delete a maintenance, change status, log in) generates an event that is stored and searchable. It supports compliance, governance and incident investigations of the "who touched that rule yesterday?" kind.
Who uses it
The trail is not a day-to-day operational tool. It serves three fronts:
- Compliance and internal audit: reviewing changes over a period to evidence control. Useful for ISO, SOC 2, LGPD and client audits.
- Platform administration: understanding who created, edited or removed resources. Important when the tenant has more than one admin and the team needs to align responsibilities.
- Incident investigation: when something breaks, the first question is usually "what changed?". The trail answers, with timestamps and the full request payload.
For alert behavior (who fired, when, for how long), the right place is the Alerts History. The Trail is about human action on the platform, not about events from the monitored environment.
What is audited
The trail covers administrative and configuration actions. The list is not exhaustive, but gives a clear idea:
- Hosts: creation, edit, deletion and status change (enable/disable).
- Alert rules: creation, edit, deletion, severity change, activation and deactivation.
- Notification channels: creation, edit, deletion and test.
- Maintenances: scheduling, edit and cancellation.
- Dashboards: creation, edit, deletion, sharing.
- Collectors (agents and hubs): registration, update, removal.
- Users and ACL: invite, level change, removal, password reset.
- Session: login, logout and denied access attempts.
- Tenant settings: global parameters, integrations, keys.
Reads and queries (opening a screen, listing hosts, downloading a report) do not enter the trail. The focus is on writes, which is what changes platform state.
The table
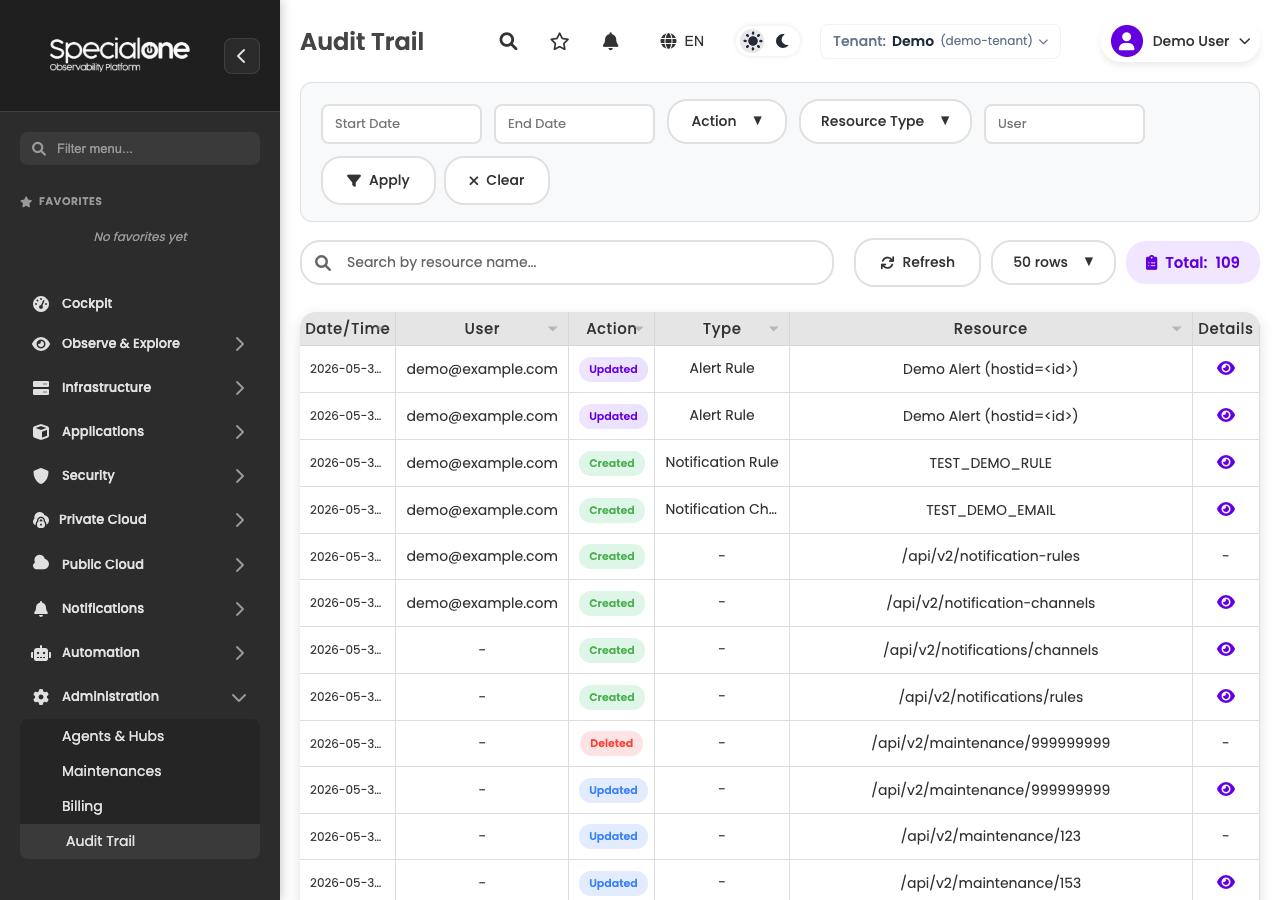
Each row is one event. The columns:
| Column | Content |
|---|---|
| Date/Time | Event timestamp in your user's timezone. Default sort: most recent first. |
| User | Email of who executed the action (e.g., admin@example.com). |
| Action | Colored badge: Create, Update, Delete or Status Changed. |
| Type | Category of the affected resource: Host, Rule, Alert, Dashboard, Maintenance, Channel, User, etc. |
| Resource | Name or identifier of the affected resource (e.g., host-srv-prd-01, dashboard-42). |
| Details | Eye icon that opens a modal with the full request payload. |
The toolbar above the table has a free-search field (matches resource name and endpoint), a Refresh button, a Rows per page selector (25, 50, 100) and the Total counter with the number of events in the current slice.
Filters
The filter bar at the top of the page combines five fields. All optional, all composed with AND (every active filter must match).
- Date from and Date to: two datepickers. The page opens on the last 24 hours by default. For monthly review, adjust to the first and last day of the month.
- Action: dropdown with All, Create, Update, Delete and Status Changed. Useful to slice only deletions over a period (an important field for compliance).
- Resource Type: dynamic dropdown that loads the list of types effectively present in the database. Lets you focus on one category, for instance only Rule when investigating alerts that changed.
- User: text field with the email. Accepts partial matching, so
@example.combrings every event from that domain.
The Apply and Clear buttons are on the right. Clear resets every field and returns to the default 24-hour slice.
Combine filters for targeted investigation
To answer "did admin@example.com touch any rule yesterday between 2 PM and 6 PM?", fill Date from and Date to with the range, Action = Update, Resource Type = Rule and User = admin@example.com. The result comes out ready to export as evidence.
Action types
Four categories cover 100% of the events, with distinct badge colors:
| Action | Color | Meaning |
|---|---|---|
| Create | Green | A new resource entered the platform. Includes hosts registered, rules created, dashboards published, channels added. |
| Update | Blue | An existing resource was modified. Name change, severity, recipient, configuration, threshold. |
| Delete | Red | Resource removed for good. The trail preserves the event, but the resource itself is gone. |
| Status Changed | Amber | State change without altering configuration: enable/disable a host, pause/resume a rule, activate/finish a maintenance. |
Splitting Update from Status Changed helps reading: when you want to know "who disabled that rule", just filter by Status Changed and ignore the noise of configuration edits.
Event detail
The eye icon in the Details column opens a modal with the full event.
The modal has two sections:
Metadata (two columns):
- User: executor's email.
- Date/Time: event timestamp.
- Action: colored badge (same as the table).
- Status: HTTP response code.
200or201mean success;4xxmeans the action was attempted but rejected (e.g., validation failed, permission denied).4xx/5xxevents also stay in the trail, and are useful to investigate improper access. - Resource Type: category.
- Resource: name or ID.
- Endpoint: API route called (e.g.,
PUT /api/rules/123).
Payload: JSON block with the full request body. This is what the user sent, before the database stored it. On Update actions, that JSON is the source of truth to reconstruct the previous state, comparing it with the resource's current state.
When to open the detail
The table answers who, when, what. The modal answers how. Use it whenever you need granular evidence: the exact value configured, the recipient inserted, the threshold changed. In formal audits, capture the JSON as an attachment to the report.
Expanded filtering
The filter bar groups the most frequently used fields. For larger slices or to share results with the team, combine them with the toolbar's free search.
The free search matches Resource and Endpoint at the same time, so typing host-srv-prd-01 brings every action that touched that host, regardless of the operation type.
Limits and retention
The page is designed for targeted investigation, not for statistical analysis of large volumes:
- Pagination: up to 200 rows per page. Default is 50, and the toolbar selector offers 25, 50, 100. To go beyond 200, refine the filters (smaller period, specific type, single user).
- Navigation: standard
< 1 2 ... N >. The total page count comes from the toolbar counter. - Retention: to be defined with SpecialOne, according to the contracted plan. As a rule we keep long history (months), but if you need to export evidence for external audit, it is worth aligning the exact window that will be preserved.
ACL
Access to the Audit Trail is restricted to tenant admins. Operational users do not see the menu and cannot call the API.
ACL changes themselves are audited. When someone promotes a user to admin, the event shows up in the trail as Status Changed on the User resource, and the modal payload shows the old and new levels.
The trail records, it does not block
Auditing is a detective control, not a preventive one. If an admin acts improperly, the action still happens, but it stays recorded. For preventive control (limit who can do what), the place is the ACL configuration under Administration → Users.
Use cases
Who edited that rule yesterday?
- In Date from and Date to, slice the last 24 or 48 hours.
- In Action, choose Update.
- In Resource Type, choose Rule.
- In the toolbar search, type the rule name.
- Click the eye icon on the relevant row to see the payload and confirm exactly what was changed.
Monthly audit of changes
- In Date from, first day of the month at 00:00.
- In Date to, last day of the month at 23:59.
- Action: All (to get the full picture).
- Walk through by user or by type, following the report structure.
- Capture the JSON of critical events (creation and deletion) as an attachment.
For formal evidence, also capture the active filter bar, to show the slice used.
Investigate an incident: what changed in the last 4 hours?
When a rule stopped firing or a host disappeared from the view, the script is:
- In Date from, now minus 4 hours.
- In Date to, now.
- Resource Type: leave All on a first sweep.
- In the toolbar, sort Date/Time ascending, to read in chronological order.
- Look for red events (Delete) or amber events (Status Changed) involving the affected resource.
On configuration incidents, the trail commonly cuts several hours from the investigation path.
Best practices
- Weekly review: set aside 15 minutes once a week to scan the week's events. The sooner you spot an unexpected change, the cheaper the fix.
- Standardize naming: the Resource column shows the name of the resource at the moment of the action. If your team follows a convention (
host-srv-prd-01,rule-cpu-high-web), reading the trail becomes intuitive and saves you from opening the modal on every row. - Export for evidence: for formal audits, capture screenshots of the filtered table and the JSON modal of relevant events. It also helps to save the URL with applied filters in the audit ticket description.
Next steps
-
Alerts
The operational screen, real time, with alerts in progress. Every change to an alert rule shows up in the Trail.
-
Alerts History
Lists alerts that have already resolved, with start, end and duration. For comparison on chronological searching.
-
Notification rules
Who receives what, when and through which channel. Rule changes are audited.
-
Collectors
Agents and hubs registered in the tenant. Administrative actions on collectors enter the Trail.
-
Maintenances
Scheduled windows to silence alerts. Scheduling and cancellation are audited.