Storage
Dedicated page for storage instances: SAN/NAS arrays, backup appliances, shared file systems and any storage resource that exposes metrics (SNMP, vendor API or agent).
The page itself is an inventory of monitored instances, with consolidated state and shortcut to the detail. Registration happens elsewhere (see How an instance gets here).
The list
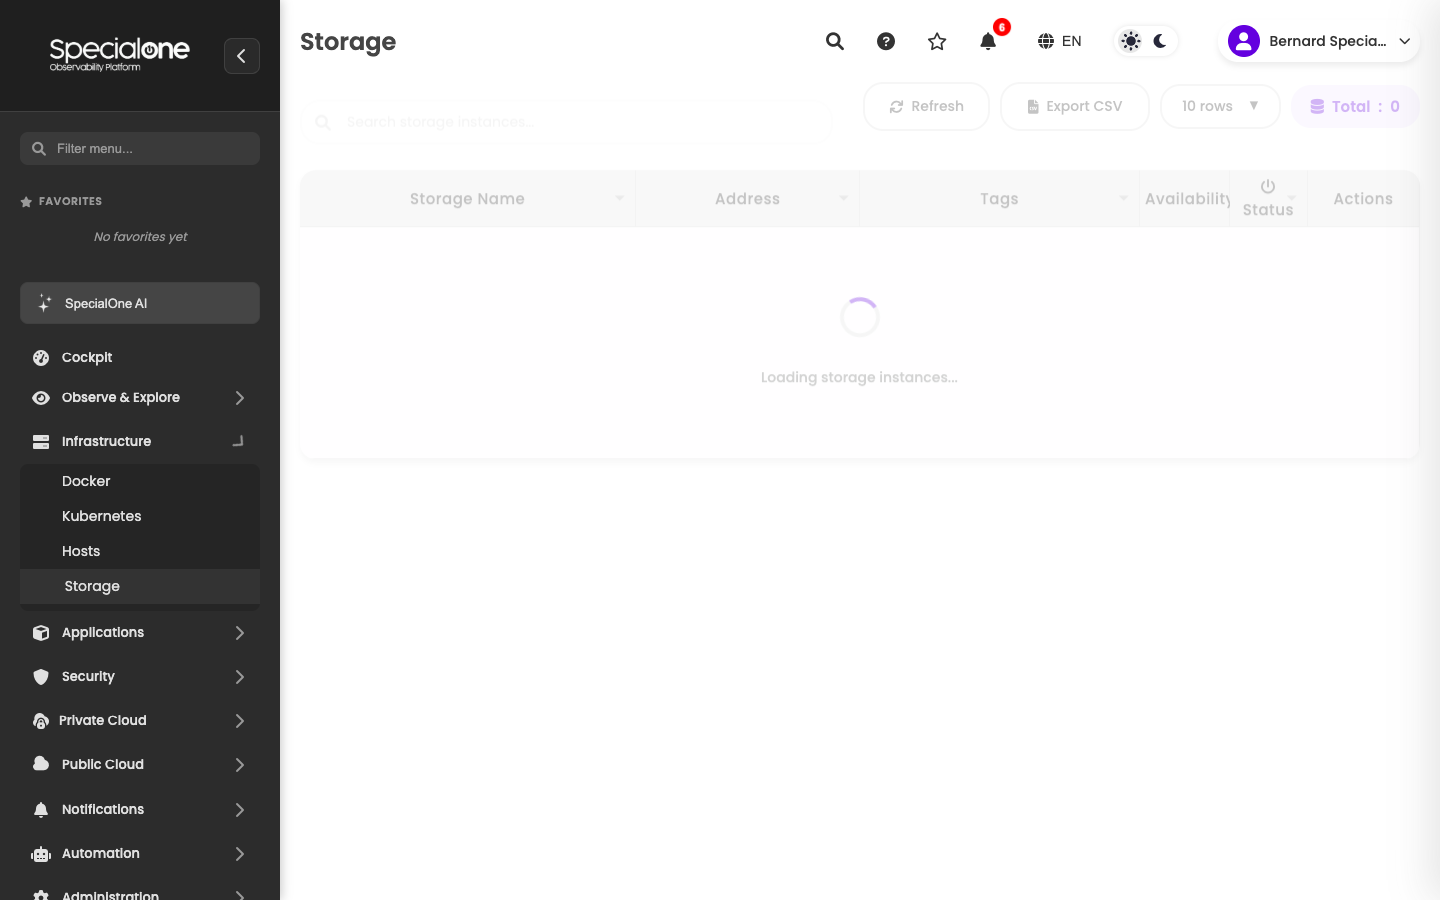
Reached from Infrastructure → Storage. On a fresh tenant the list is empty, as in the print. Columns:
| Column | What it shows |
|---|---|
| Storage Name | How the instance appears on the platform. |
| Address | IP or hostname the collector uses to reach the storage. |
| Tags | Free labels (e.g. backup, tier-1, production). |
| Availability | Indicator of the latest check. |
| Status | Consolidated state. |
| Actions | Quick operations menu. |
Above the table sit the standard controls (search, refresh, export CSV, pagination).
How an instance gets here
The Storage page does not register new storage directly. Unlike Network, there is no "Add" button here. Instances show up via two paths:
Path 1: Automatic discovery
The collector (hub) can discover storages automatically in two situations:
- When it monitors a host (Linux/Windows) with the agent and the agent identifies mounted storage volumes or connections to arrays.
- When the collector scans a network range via SNMP and detects devices whose identifier (sysObjectID) matches a known storage profile (NetApp, Dell EMC, HPE, etc).
After discovery, the storage enters the pending-approval list. See Discovery.
Path 2: Apply a storage profile on an existing host
When storage is exposed as part of an already-monitored server (e.g. a Linux file server with NFS exports), you can enable storage collection by applying the matching monitoring profile on the host's Configuration tab.
The step by step is the same as in Docker → Enable monitoring on a host, swapping the Docker profile for the appropriate storage profile. Summary:
- Confirm the host is under Infrastructure → Hosts and has an active agent.
- Open the host detail → Configuration tab → CI Configuration sub-tab.
- On the Monitoring profiles card, add the storage profile (e.g.
NFS Server,SMB Server, vendor-specific). - Within minutes collection starts and the instance shows up here on the Storage page.
No standalone storage registration in the UI today
For dedicated appliances (SAN array, NAS without an associated server) that do not fit either path above, registration is done by the collector directly, or via manual profile configuration by the implementation team. Reach out to SpecialOne support if you need to monitor a storage that does not appear naturally.
The instance detail
Clicking a row takes you to the instance page. The tabs follow the same model as other resources: Metrics, Alerts, Configuration.
The Metrics tab carries storage-specific data:
- Total capacity and used/free per volume or pool.
- IOPS (read/write operations per second).
- Latency average for reads and writes.
- Throughput in MB/s.
- Health/Status of components (controllers, disks, power supplies).
- When the profile is for backup: last job status, age of the most recent backup, recent failures.
Alerts and Configuration tabs
Both follow the same model as other host types. Refer to the Hosts page:
- Configuration tab: instance attributes, applied monitoring profiles, collected metrics and configured alerts.
- Editing an alert on the host: how the custom copy works when you tune a profile-inherited alert.
Typical storage alerts
Default profiles cover common situations in the instance's Configured Alerts sub-tab:
- Volume low on free space (threshold configurable via host variable).
- I/O latency above normal.
- Accelerated usage growth (trend projecting exhaustion in N days).
- Component in degraded state (disk failed, controller in failover).
- Backup failed or backup too old (job did not run).
- Replication out of sync between sites.
These alerts follow the same routing flow via notification rules and can be silenced via maintenance.
Next steps
-
Other resources
Hosts, Docker, Kubernetes, Network and DCIM follow the same configuration and alerts model.
-
How alerts work
From alert definition to notification channel.