Zadara
Dedicated page for the Zadara instances the tenant operates. Each row represents one instance of the customer's Zadara cloud (storage array, compute environment or private/hybrid cloud) that the SpecialOne platform reaches via the management API to collect health, capacity and performance.
The page is first and foremost an inventory with consolidated state and a shortcut to the detailed graphs of each instance. Registration is done right on this page (collection happens through the collector talking to the Zadara API, no agent involved).
Who uses it
- Infrastructure team: tracks capacity and health of the instances.
- Storage team: watches IOPS, latency and volume growth.
- Platform team: correlates Zadara events with applications consuming that storage (via dashboards and notification rules).
If the Zadara instance serves volumes to monitored servers or clusters, it is also worth tracking from the Storage page, which sees consumption from the host side. The two viewpoints complement each other.
The list
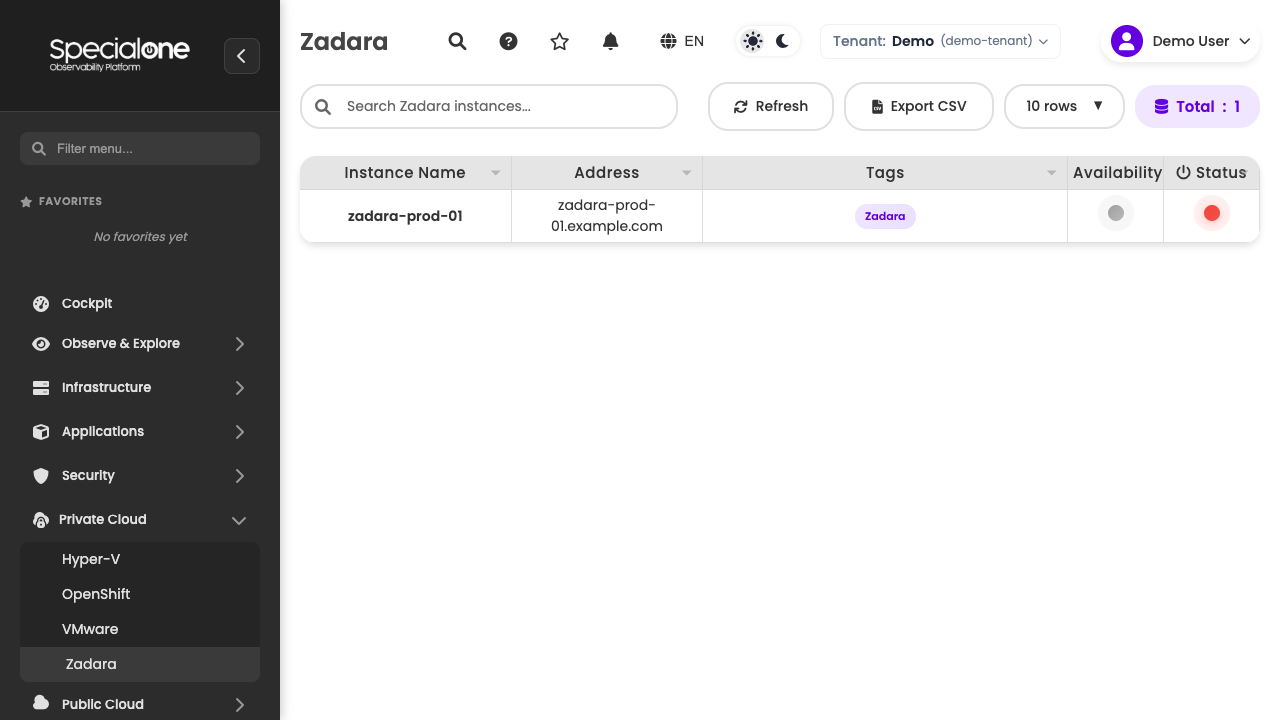
Reached from Cloud → Zadara (internal URL /zadara-monitoring). On a fresh tenant the list is empty. Columns:
| Column | What it shows |
|---|---|
| Instance Name | How the Zadara instance appears on the platform (e.g. zadara-prod-01). |
| Address | IP or hostname the collector uses to reach the management API (e.g. zadara.example.com, 192.0.2.10). |
| Tags | Free labels (environment, internal-customer, role). They show up in filters and in notification rules. |
| Status | Consolidated state of the latest check (green, yellow, red). |
| Actions | Three-dot menu with Edit, Delete and shortcut to the Drill-down. |
Above the table sit the standard controls:
- Search by name or tag.
- Refresh: forces data reload.
- Export CSV: downloads the current list.
- Add Instance: opens the registration modal (see Registering an instance).
- Rows per page and pagination at the bottom.
Use tags to separate environments
On tenants with more than one Zadara instance, standardize tags by environment (prod, staging), role (block-storage, object-storage, compute) and internal-customer when Zadara serves distinct business areas. Tags appear on the list, become a quick filter and are the routing basis for notification rules.
Registering an instance
Registration happens right on the page: click Add Instance at the top of the list.
Prerequisites
Before registering, make sure:
- The platform's collector (hub) has network reachability to the Zadara endpoint on the management API port (typically HTTPS on 443). Open the collector's firewall to the instance IP/hostname.
- An API credential exists in Zadara with read permission (access token or key/secret pair, depending on the Zadara platform version in use).
- You know the internal name you want to use for the instance on the platform and the address (IP or hostname) of the management API.
- Optional: define the initial set of tags the instance will carry.
Steps
- Under Cloud → Zadara, click Add Instance.
- Fill the modal:
- Instance Name: how it appears on the list (e.g.
zadara-prod-01). - Address: hostname or IP of the Zadara endpoint (e.g.
zadara.example.com,192.0.2.10). - Credential: API token or key/secret pair. Stored encrypted and bound to the instance.
- Collector: which hub runs the collection. On environments with more than one, pick the one on the same management network as Zadara.
- Tags (optional): key-value pairs for classification.
- Instance Name: how it appears on the list (e.g.
- Click Save.
The instance appears on the list. The collector runs the first API call within minutes: on response, the Status column turns green and metric collection starts. If Status stays red, review address, credential and firewall rule.
Credential lives on the instance, not on the collector
Unlike the SNMP flow on Network, here the credential is per Zadara instance. That way the same collector can monitor several instances with distinct credentials.
What the collector brings to the platform
From registration onwards, the collector runs the default Zadara monitoring profile, which defines which metrics to query via API and which alerts are enabled by default. See Monitoring profile for the general concept.
Instance detail
Clicking a row (or Drill-down in the actions menu) opens the instance detail page. The focus is answering three questions quickly: is there room, is it fast, are there open alerts.
The page brings:
- KPIs at the top: total capacity and used percentage, current IOPS (read + write), current average latency, open alert count.
- Period selector (default Last 1 hour; expandable to 24h, 7d, 30d or custom).
- Time series graphs:
- Used capacity versus total, per pool or per volume.
- IOPS (read and write operations per second).
- Average latency for read and write in ms.
- Throughput in MB/s.
- Component health (controllers, drives, power supplies), with a colored indicator for each.
- Recent alerts on the instance: compact list with alert name, severity and timestamp.
The breadcrumb at the top (Cloud › Zadara › instance-name) takes you back to the list with one click.
Metrics and alerts follow the general model
For the full picture of how alerts reach this instance (inherited from the monitoring profile) and how to tune them if a local adjustment is needed, refer to the Hosts page:
- Configuration tab: instance attributes, applied profiles, collected metrics and configured alerts.
- Editing an alert on the host: how the custom copy works when you tune a profile-inherited alert.
The practical difference is just the set of applicable profiles (Zadara-specific) and the collection method (Zadara platform API, no agent).
Edit and manage
From each row's Actions menu you can:
- Edit: adjust name, address, credential, collector and tags. Credential updates take effect on the next collector run.
- Delete: removes the instance from the platform. Collection stops immediately and history is kept for the tenant's standard retention window before being discarded.
- Drill-down: shortcut to the detail page (also reachable by clicking the row directly).
In bulk, use Export CSV to generate a spreadsheet with the filtered list (useful for customer reviews or inventory reconciliation).
Before deleting, consider pausing
If the goal is to stop receiving alerts during a window (credential rotation, IP change, Zadara maintenance), prefer applying a maintenance on the instance. Deleting and re-registering loses the history.
Typical alerts
The default Zadara profiles cover situations that show up on the instance's Configured Alerts sub-tab:
- Capacity approaching the limit (pool or volume usage percentage above the threshold configured by variable).
- Accelerated usage growth (trend projecting exhaustion in N days).
- I/O latency above normal for read or write.
- IOPS saturating the contracted/dimensioned limit for the instance.
- Controller in degraded state or in failover.
- Drive failed inside a pool.
- Backup job failed (when the backup profile is applied and Zadara is orchestrating snapshots/replication).
- Replication out of sync between Zadara sites.
- Zadara API unreachable: the collector cannot complete the query (severity High or Critical depending on how long without collecting).
Severities follow the platform standard (Critical, High, Medium, Information), described under Severity. All these alerts follow the same routing flow via notification rules and can be silenced via maintenance during planned interventions (hardware replacement on Zadara, version upgrade).
Limits
- Collection depends on Zadara management API availability. If the API is down, the platform marks the instance as unreachable and fires the matching alert, but cannot bring fresh data until the API recovers.
- The collection interval is defined by the applied monitoring profile (default in the order of minutes, enough to follow capacity and average latency). For tighter granularity, talk to the implementation team.
- Raw history is retained per the tenant's retention policy. For long-range analysis (years), check the aggregated data configuration.
- No automatic discovery of Zadara instances via network scan: each instance is registered explicitly on this page. For storage exposed on the host (mounted volume, NFS), use Storage.
- The page does not replace the native Zadara console for deep operations (creating volumes, managing snapshots). Its role here is observability: health, capacity and alerts in one place, alongside the rest of the infra.
Next steps
-
Storage on the host
How the platform sees storage from the server side that consumes it.
-
Hosts
General configuration model, Configuration tab, alert editing.
-
Alerts
How alerts work, from firing to notification channel.
-
Concepts
Monitoring profile, metric, notification rule, maintenance.