Network
Dedicated page for network devices: switches, routers, firewalls, access points, load balancers and any equipment that answers over SNMP or has a monitoring API supported by the platform's profiles.
Collection is done by the collector (hub) talking directly to the device: no agent in the flow, unlike Hosts and Docker. That is why registration is independent of the Hosts page (you add the device directly here).
The list
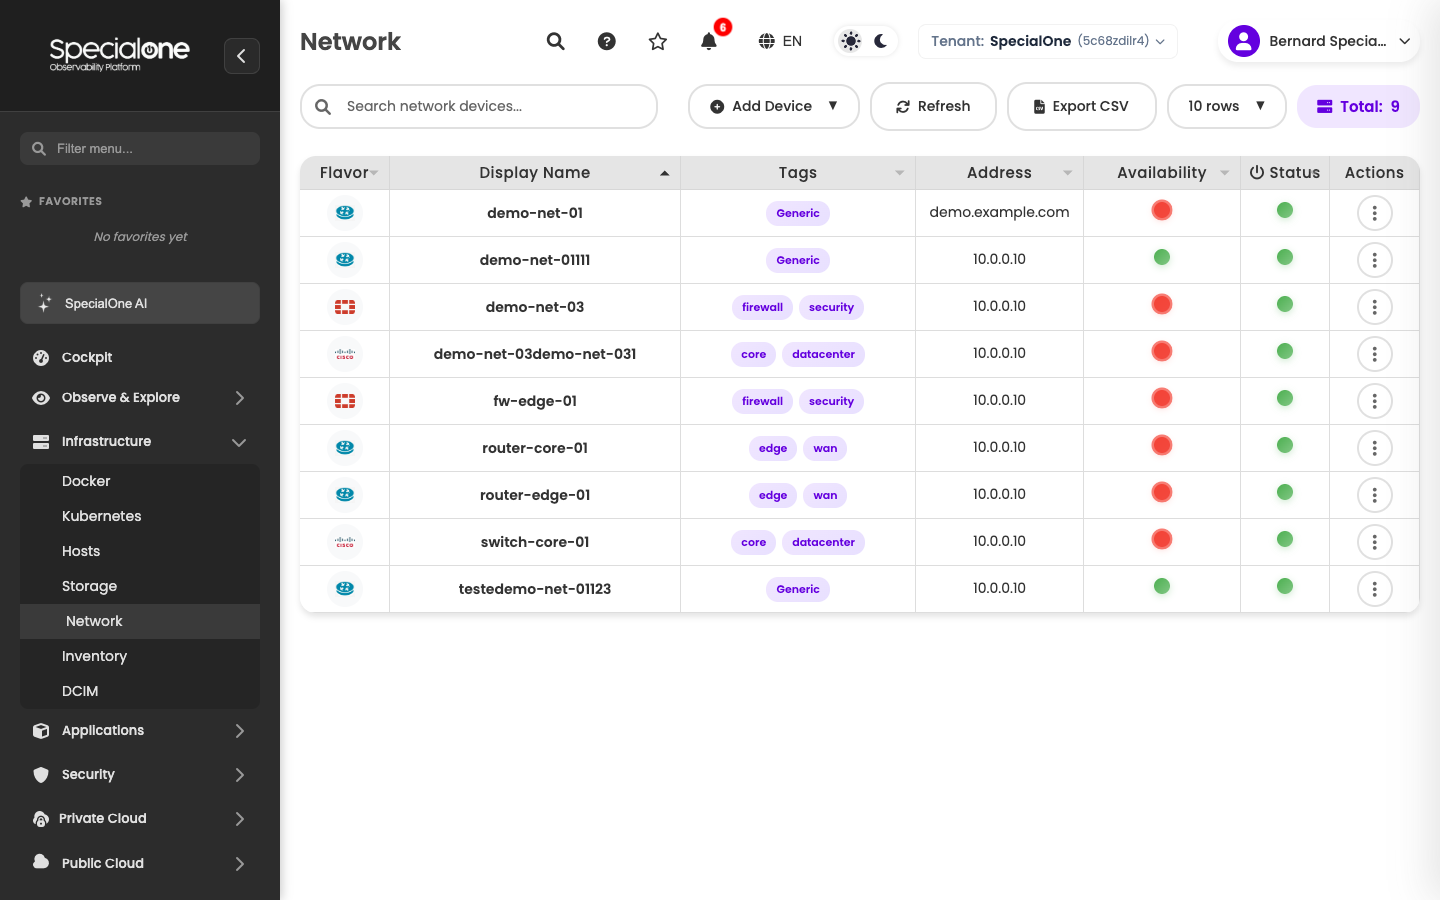
Reached from Infrastructure → Network. The columns reflect what matters in network:
| Column | What it shows |
|---|---|
| Flavor | Equipment family/vendor (icon): Cisco, Juniper, Fortinet, Mikrotik, generic SNMP, etc. Drives which monitoring profile applies. |
| Display Name | How the device appears on the platform. |
| Tags | Free labels (e.g. core, edge, wan, datacenter, firewall). |
| Address | IP or hostname the collector uses to reach the equipment. |
| Availability | Indicator of the latest check (ICMP or SNMP get). |
| Status | Consolidated state. |
| Actions | Quick operations menu. |
Above the table sit the standard controls (search, refresh, export CSV, rows per page) and the Add Device button, which opens a dropdown with the two ways to bring an equipment in (see Adding a device).
Use Flavor to understand the profile
Flavor is not just decoration: it decides which metrics the collector asks for via SNMP and which alerts the default profile enables. A device marked as Cisco IOS gets a different profile than a Fortinet, even when both are firewalls.
Adding a device
Unlike Docker (which inherits from an existing host) and Kubernetes (which needs a Helm chart), here registration happens right on the page. There are two paths:
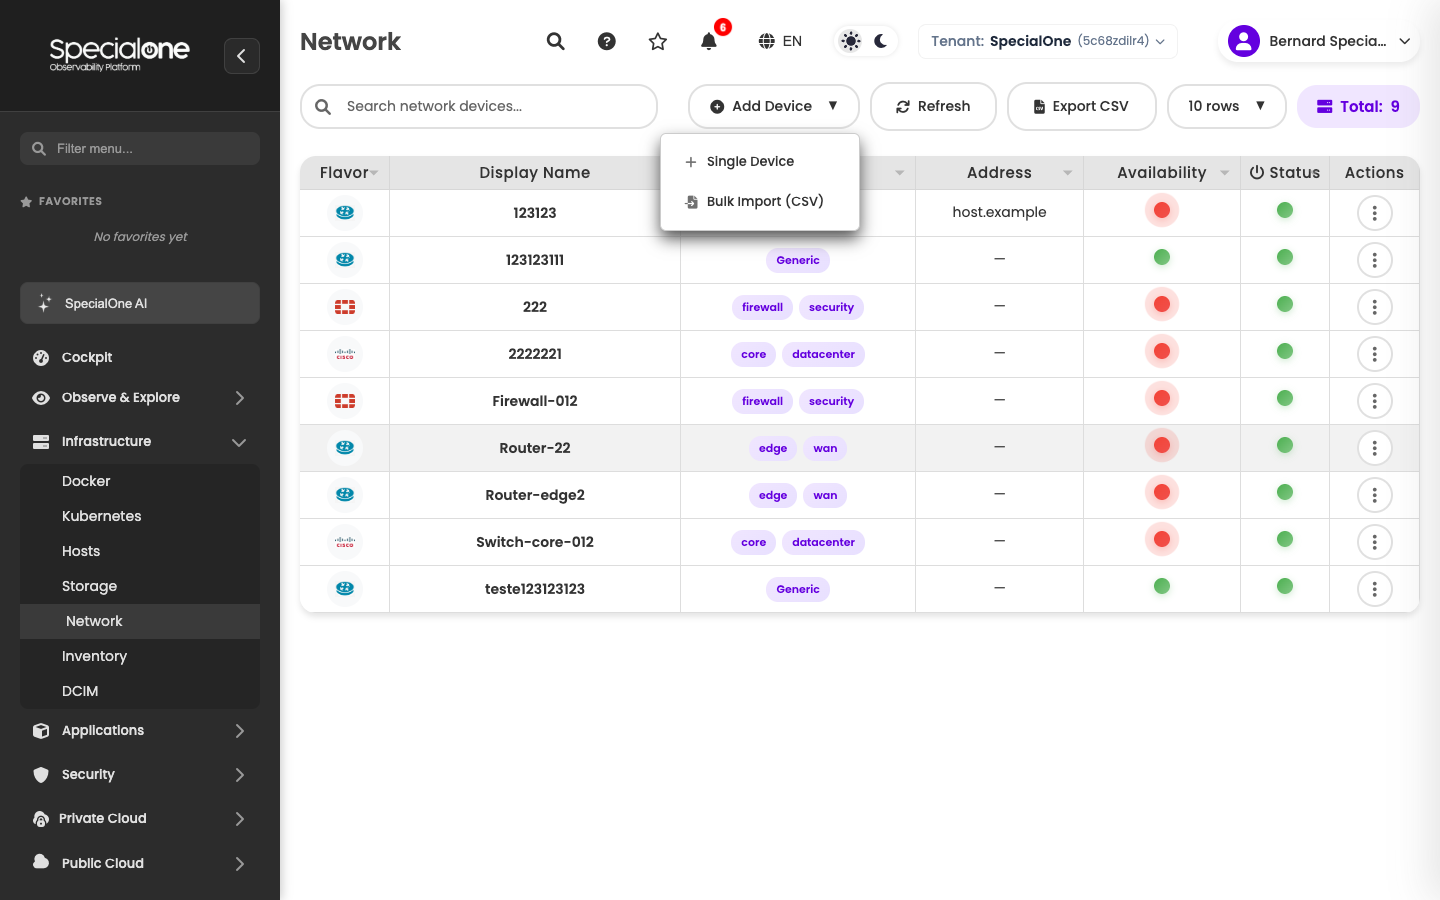
- Single Device: one-by-one registration via form.
- Bulk Import (CSV): to onboard a whole fleet of switches/routers at once from a file.
Prerequisites
Before registering, make sure:
- The platform's collector (hub) has network reachability to the device. It must hit the IP/hostname on the right ports (UDP 161 for SNMP, ICMP for ping).
- SNMP is enabled on the device, with community string or SNMPv3 credential defined and known.
- You know the vendor and model so you can pick the correct Flavor (Cisco, Juniper, Fortinet, Generic, etc).
Path 1: Single Device
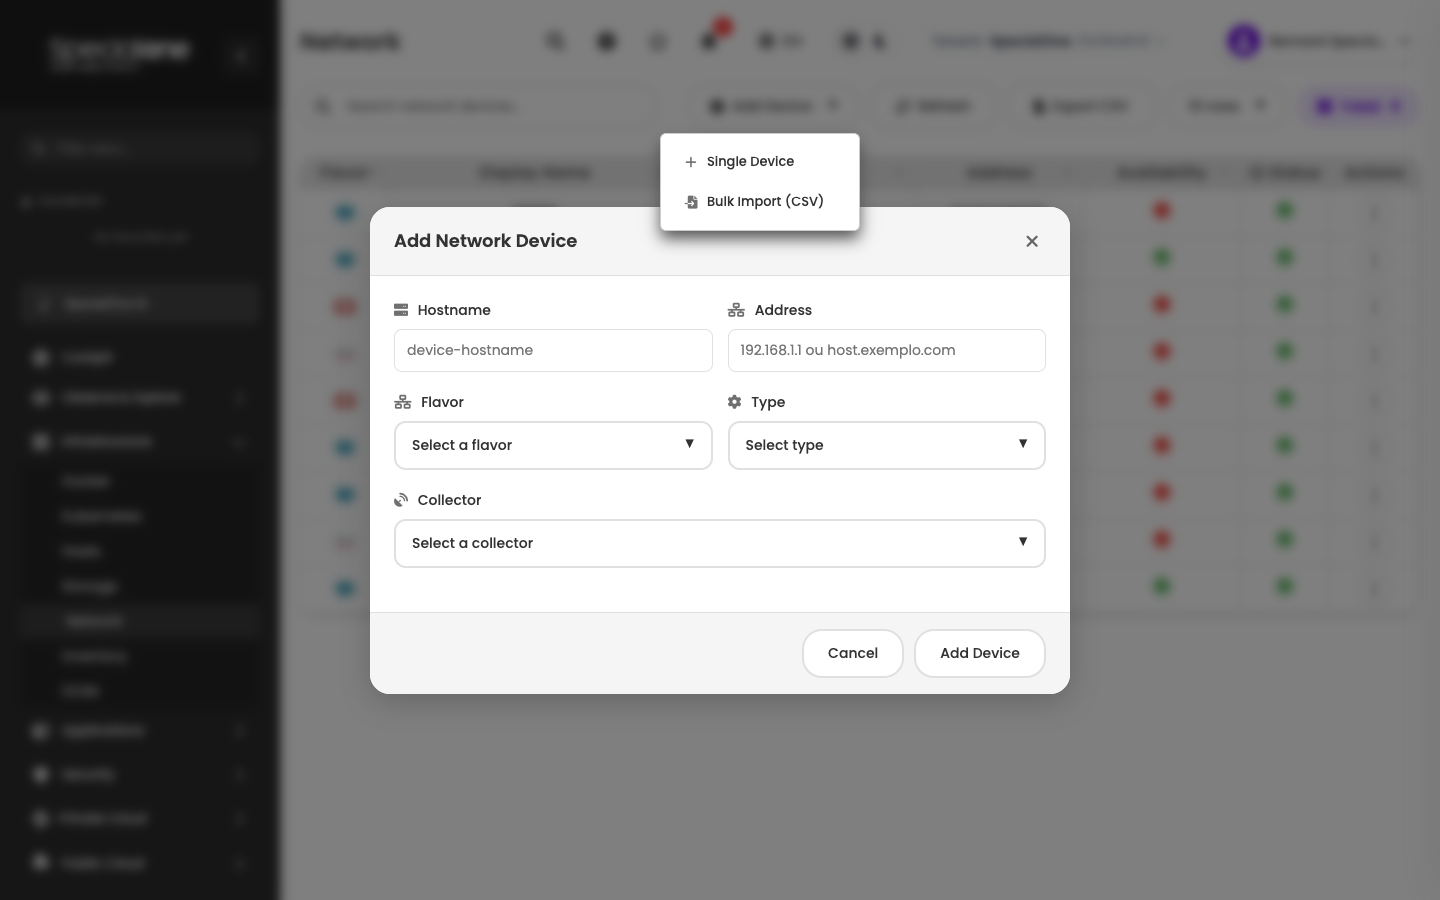
- Under Infrastructure → Network, click Add Device → Single Device.
- Fill the fields:
- Hostname: internal name of the device, as it appears on the platform (e.g.
core-sw-01). - Address: IP or FQDN the collector will use to talk to the equipment.
- Flavor: vendor/family (Cisco, Juniper, Fortinet, Mikrotik, Generic SNMP, etc).
- Type: equipment type (switch, router, firewall, access point, load balancer).
- Collector: which hub will do the collection. On environments with more than one, pick the one in the same management network as the device.
- Hostname: internal name of the device, as it appears on the platform (e.g.
- Click Add Device.
The device appears on the list. The collector runs the first SNMP get attempt within minutes: on response, the Availability column turns green and metrics start populating. If it stays red, review SNMP/credential settings.
SNMP credentials are not in this form
By default, credentials (community or SNMPv3) live on the collector, not on each individual device. If you need a different credential for a specific equipment, adjust it after creation, on the Configuration tab of the device detail.
Path 2: Bulk Import (CSV)
To onboard many devices at once, use Add Device → Bulk Import (CSV). The modal accepts a CSV file with one line per device. Columns usually match the form (hostname, address, flavor, type, collector, tags), following the template offered by the platform.
Useful on new customer onboarding with an inventory in a spreadsheet, or when the network team delivers a ready CMDB.
The device detail
Clicking a row takes you to the device page. The tabs follow the same model as other resources: Metrics, Alerts, Configuration.
The Metrics tab content is network-specific:
- Availability over time (response to ICMP / SNMP get).
- Traffic per interface (in/out), with a selector to focus on a specific interface.
- Errors and discards per interface.
- CPU and memory of the equipment, when the vendor's SNMP exposes it (depends on Flavor).
- Interface table with name, description, admin/operational status, speed and MAC address.
Alerts and Configuration tabs
Both follow the same model as other host types. Refer to the Hosts page:
- Configuration tab: device attributes, applied monitoring profiles, collected metrics and configured alerts.
- Editing an alert on the host: how the custom copy works when you tune a profile-inherited alert.
The practical difference is just the set of applicable profiles (vendor-specific) and the type of metric collected (everything via SNMP instead of agent).
Typical network alerts
The default profiles cover situations that show up in the device's Configured Alerts sub-tab:
- Device unreachable (ICMP / SNMP timeout).
- Interface down (
ifOperStatus down) on an interface marked as critical. - Traffic above threshold on an uplink interface.
- Errors and discards above normal per minute.
- CPU/memory of the equipment above the limit.
- Short link flaps (flapping).
These alerts follow the same routing flow via notification rules and can be silenced via maintenance during planned interventions.
Next steps
-
Other resources
Servers, containers and storage follow the same configuration and alerts model.
-
How alerts work
From alert definition to notification channel.