Observability and Inventory integrations
Service Management talks to the other platform modules: Observability opens tickets on its own from alerts and delivers the technical context inside the ticket, and Inventory shows what each ticket impacts.
Automatic opening from alerts
With ticket automation enabled, a monitoring alert opens the ticket automatically: title with severity and host, description with the alert details and a link to the alerts screen. The automation deduplicates (the same alert never opens two tickets) and the requester shows as Monitoring.
Observability integration (Monitoring tab)
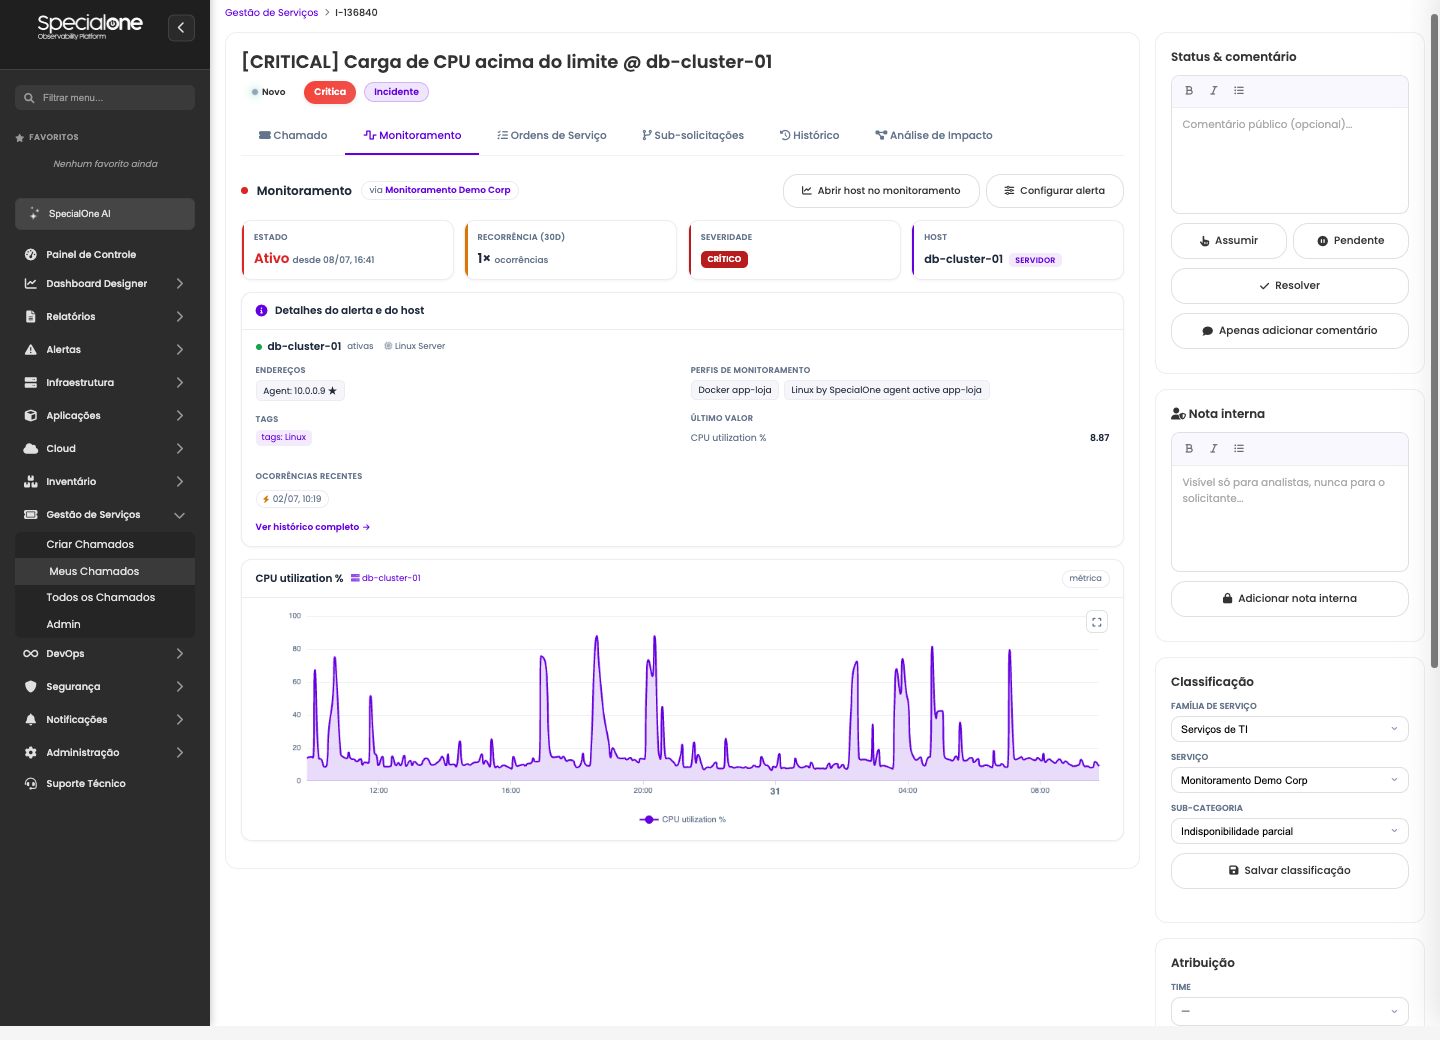
On tickets opened from alerts, the Monitoring tab brings Observability inside the ticket:
- Live state: whether the alert is still active (with its start time) or already recovered, straight from Observability, not from the ticket text.
- Recurrence (30 days): how many times this same alert fired in the period, with recent occurrences listed. It is what separates a one-off incident from a chronic problem.
- Host details: addresses, tags, applied monitoring profiles and the latest value of the related metric.
- Metric chart: the series of the metric behind the alert (CPU utilization in the example), showing behavior before and during the problem.
- Shortcuts to open the host in Observability and to configure the alert, when the diagnosis needs more depth.
The agent sees the real state of the environment without leaving the ticket and without needing access to the technical screens.
Impact Analysis tab
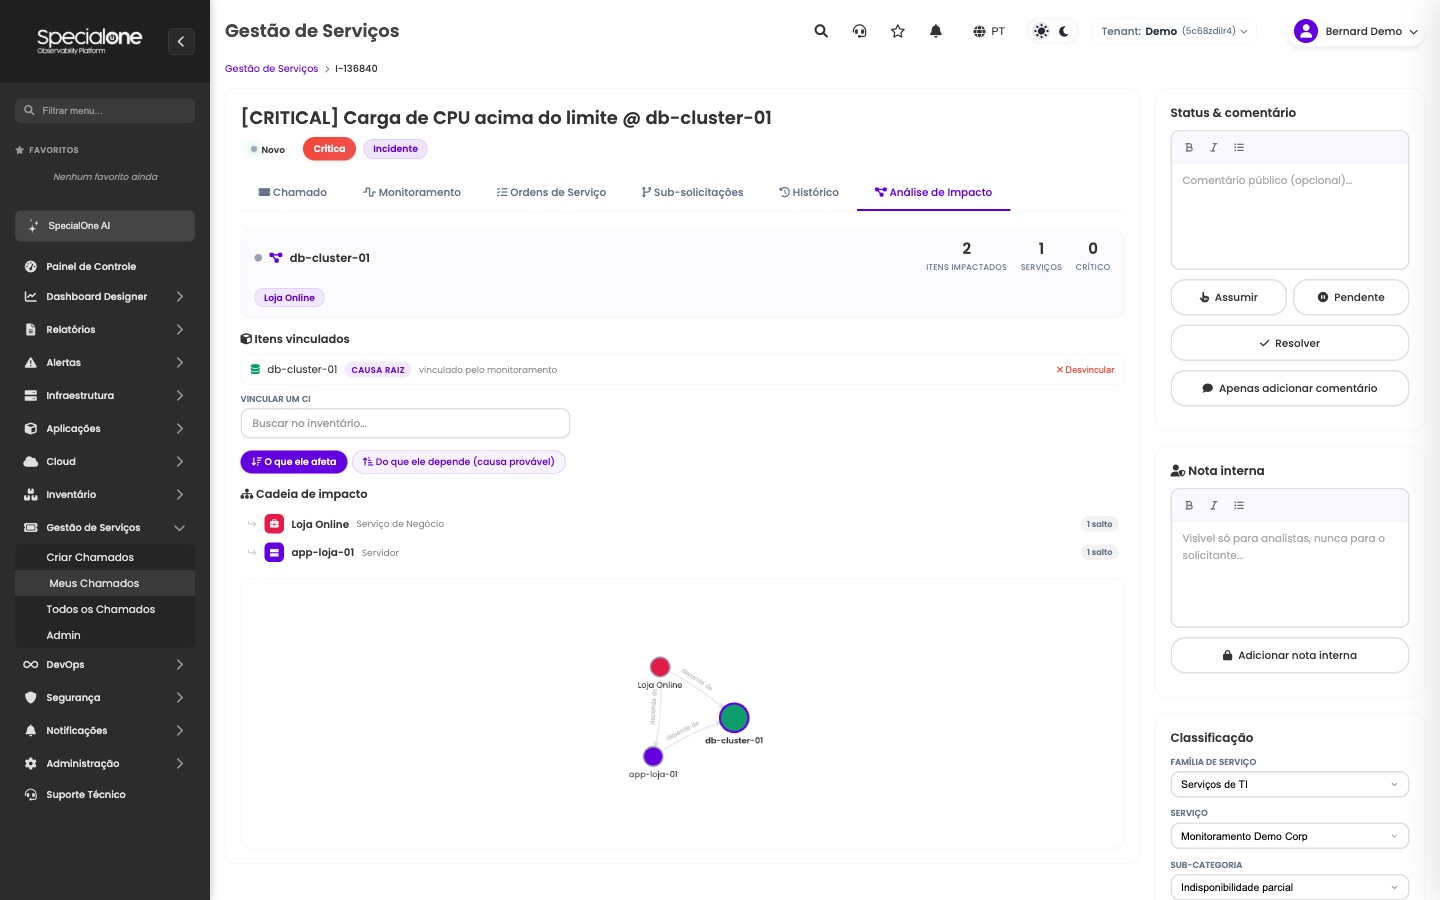
The Impact Analysis tab connects the ticket to the inventory:
- Linked items: on tickets opened by monitoring, the alert's host is linked automatically as root cause (marked "linked by monitoring"). Other items can be linked manually by searching the inventory.
- Impact chain: starting from the item, the platform walks the
inventory dependencies and shows what is affected, up to the business
services. In the example, high load on the
db-cluster-01database impacts the Loja Online service. - The buttons switch the direction: what it affects (impact) or what it depends on (probable cause).
The summary on top counts impacted items, affected services and how many are critical, a quick read of the ticket's real severity.
For the chain to work, the tenant's inventory must be enabled with dependencies mapped (see the Inventory section).
Automating the handling itself
The integration does not stop at opening: the Automation module also acts on tickets. Ready-made Service Management automations close resolved tickets with no reopening, distribute by round-robin, route by category, set priority and move to pending, and the Ticket triggers agent automation goes further: a ticket within scope fires a runbook on an automation agent, paving the way for self-handled tickets (the alert opens the ticket, the runbook fixes and documents). The Automation Report shows how much of this the platform is solving on its own.
Next steps
-
Service Management automations
Auto-close, round-robin, category routing and tickets that trigger runbooks.
-
Alerts
The monitoring alerts screen, where automatic tickets are born.
-
Inventory
The items and dependencies that feed impact analysis.
-
Administration
Catalog, SLA, queues and team: where all of this is configured.