OCI
This page is dedicated to Oracle Cloud Infrastructure (OCI) instances: tenancies and compartments observed by the platform through a read-only API credential. The collector walks the services (Compute, Block Volume, Object Storage, VCN, Load Balancer, etc), normalizes the inventory and publishes metrics for usage, availability, consumption and quotas.
The page itself is the inventory of registered accounts/compartments, with a consolidated collection status and a shortcut to the graphical detail. New registration happens right here, unlike Storage, which is read-only.
Who uses it
- SRE and On-call: want to see at a glance if the tenancy is reachable, if any resource went down and if there is an open alert coming from OCI.
- Cloud Team: tracks aggregated consumption, quotas close to the ceiling and abnormal cost by compartment.
- Platform Team: registers new accounts, manages credentials and assigns the responsible collector.
If your role does not involve OCI directly, what matters here is understanding that these instances raise alerts that show up in Alerts like any other resource.
The list
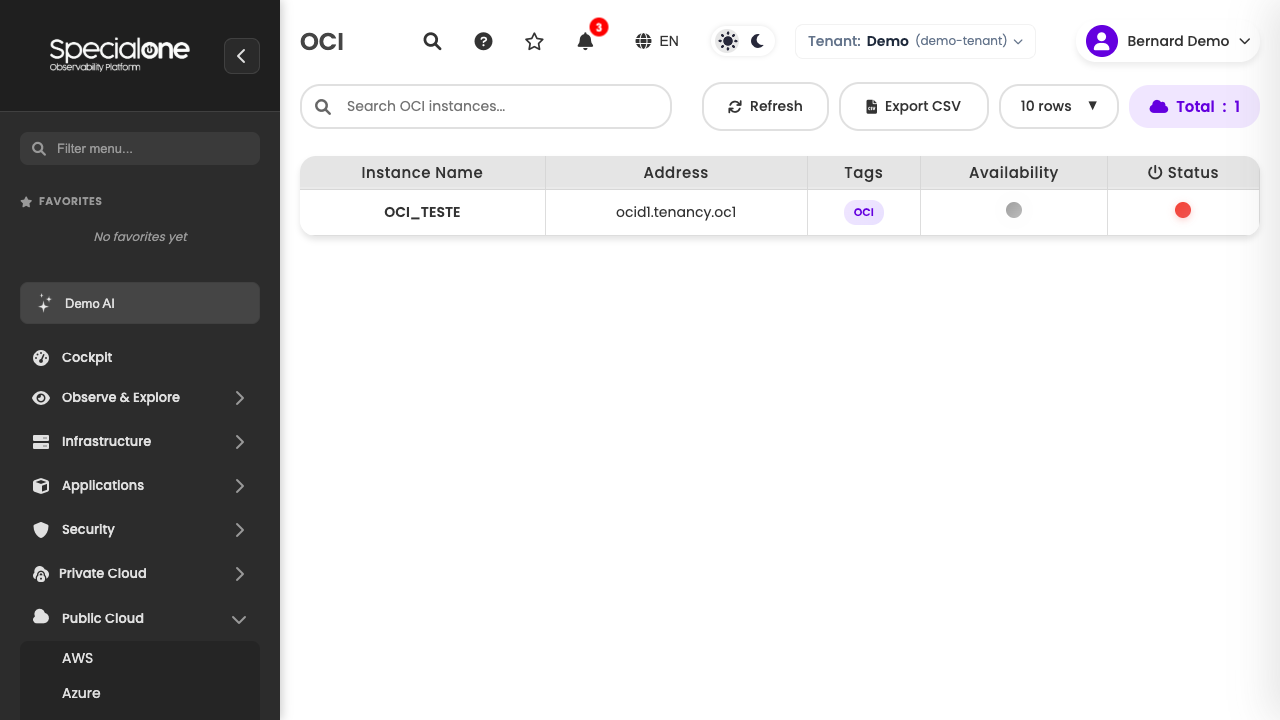
Reached via Cloud → OCI (URL /oci-monitoring). The table shows one row per registered instance. A fresh tenant starts empty.
| Column | What it shows |
|---|---|
| Instance Name | Friendly identifier of the OCI account/compartment inside the platform (e.g. oci-prod-account, oci-sandbox). |
| Endpoint | Address through which the platform reaches OCI: regional API endpoint (identity.sa-saopaulo-1.oci.oraclecloud.com) or an equivalent identity URL. |
| Tags | Free labels for grouping (e.g. production, billing, sandbox). |
| Status | Health indicator of the last collection cycle: green when the credential is valid and the API responded, red when there was an authentication failure or timeout. |
| Actions | Menu with Edit, Delete and Open details (drill-down to graphs and inventory). |
Above the table sit the standard controls: search field (filters by name, endpoint or tag), Refresh button, Export CSV and pagination at the bottom.
Sorting
Click a column header to sort. The order persists while the session is open.
Register an instance
The Add instance button opens a modal with the fields below. Before registering, make sure the prerequisites are in place:
Prerequisites
- API user created in OCI IAM, dedicated to observability (do not use a personal credential).
- API key generated for that user (PEM public/private pair).
- Read policy attached to the user group. Recommended least privilege:
If your company policy does not allow
Allow group SP1-Observability to read all-resources in tenancy Allow group SP1-Observability to read metrics in tenancy Allow group SP1-Observability to read usage-budgets in tenancyread all-resources, restrict by compartment, but keep in mind the inventory will be partial. - Tenancy OCID and User OCID written down (e.g.
ocid1.tenancy.oc1..aaa<example>,ocid1.user.oc1..aaa<example>). - Fingerprint of the public key uploaded to the OCI console.
- Home region defined (e.g.
sa-saopaulo-1).
Modal fields
| Field | What to fill |
|---|---|
| Instance Name | How it appears in the list. Use something descriptive: oci-prod-account, oci-customer-x. |
| Tenancy OCID | OCID of the root tenancy. |
| User OCID | OCID of the API user created for the platform. |
| Region | Home region of the tenancy (e.g. sa-saopaulo-1, us-ashburn-1). |
| Fingerprint | Fingerprint of the public key. |
| Private Key (PEM) | Private key content. Stored encrypted. |
| Compartments | Compartments to collect. Empty means all visible to the user. |
| Collector | Which collector (hub) owns the collection. In environments with multiple collectors, choose the one with internet egress allowed to OCI. |
| Tags | Free labels. |
After saving, the first collection runs within a few minutes. The status stays as Pending until the cycle finishes, then turns green or red.
Least privilege matters
Resist the urge to use a manage policy. The platform only needs read access. Granting write privileges enlarges the risk surface for zero functional gain.
Choosing the collector
The collector that handles OCI needs:
- HTTPS egress to the regional endpoints (
*.oraclecloud.com). - A synchronized clock (NTP), because the OCI API request signing is sensitive to drift.
- A collector version that bundles the OCI connector. When in doubt, confirm with SpecialOne support.
Instance detail
Clicking Open details (or the row itself) takes you to the instance graph page. The drill-down is organized by service:
Compute (VMs)
- List of Compute instances with shape, OCPUs, memory, state (Running/Stopped/Terminated) and uptime.
- Per-VM metrics: CPU, memory, network in/out, disk.
- Shortcut to open the corresponding host in Hosts when it is also agent-monitored.
Block Storage
- Active volumes, provisioned size, average IOPS, latency.
- Boot volumes and block volumes listed separately.
- Recent snapshots and backups.
Object Storage
- Buckets, total size stored, object count, tier (Standard/Archive).
- Read/write traffic aggregated per bucket.
Network (VCN)
- VCNs, subnets, security lists, NAT/IGW, Load Balancers with listeners and backends.
- Traffic per interface, active connections.
Quota and cost
- Current month consumption by service.
- Quotas with an indicator of how much room is left before the ceiling (vCPU, IPs, etc).
- Trend projecting overflow when applicable.
Linked alerts
Final block listing the open alerts tied to the instance. Each row leads to the detail in Alerts.
Edit and manage
The Actions menu on each row offers three operations.
Edit
Reopens the registration modal with current values (the private key is masked, only replace it if you are rotating the credential). Use it to:
- Adjust tags.
- Change the list of monitored compartments.
- Replace the API key when rotating credentials.
- Move the instance to a different collector.
Changes take effect on the next collection cycle.
Delete
Removes the instance and stops collection. Historical metrics and alerts remain available for 90 days, then are purged. It is not reversible: to bring it back, register again.
Confirm before deleting
Deleting in production means wiping active monitoring. Make sure another coverage exists (or that the tenancy was decommissioned) before confirming.
Drill-down (open details)
Same destination as clicking the row. Useful when you want to open it in another tab via the browser context menu.
Typical alerts
The default OCI monitoring profiles already ship with built-in rules. Severities follow the platform standard: Critical, High, Medium, Information. The most common ones:
- Tenancy unreachable (Critical): credential failed or API did not respond for 3 consecutive cycles.
- Resource unavailable (High): Compute instance in an abnormal state (prolonged
stopping, stuckterminating). - Quota close to the limit (Medium): consumption above 80% of the quota ceiling (vCPU per region, public IPs, buckets).
- Volume out of space (High): block volume with usage above 90%.
- Backup failed (Medium): the latest automated backup policy did not run or returned an error.
- Abnormal cost (Medium): today's spend diverged from the 7-day moving average.
- Load Balancer with no healthy backend (Critical): every backend of a listener is in
Criticalstate. - Certificate close to expiration (Medium): OCI-managed certificates with less than 30 days to expire.
These alerts flow through the same routing via notification rules and can be silenced via maintenance.
Limits
- OCI API pagination: collection pages through 100 items per call. Very large tenancies (>5k resources) may take a few minutes for a full cycle.
- Collection timeout: each API call has a 60 second ceiling. If a region is slow, that service is marked as partial for the cycle, without invalidating the rest.
- Minimum interval: inventory collection runs every 5 minutes. Instant metrics (CPU, memory) follow the interval of the monitoring profile applied.
- Compartments: up to 200 compartments per instance. Above that, split into two entries (e.g. by business line).
- Throttling: OCI applies rate limiting per tenant. If the collector hits HTTP 429 often, the cycle is automatically stretched.
- History: detailed data is kept for 90 days. Daily aggregates for 13 months.
Next steps
-
Hosts
OCI Compute VMs that also run the agent show up under Hosts.
-
Alerts
How alerts coming from OCI are presented, routed and handled.