Reports
The page that gathers the aggregated and periodic analyses of the tenant. Unlike the Cockpit, which shows real-time health, and My Dashboards, which is fully customizable and meant for live monitoring, Reports delivers consolidated views built for compliance, auditing and planning.
Each report answers a business question. How much availability did the systems have this month? Which alerts caused the most noise in the last 30 days? Is the fleet under or over sized? From those questions, the platform produces the numbers, the charts and the exportable files to send to whoever needs to receive them.
Who uses it
- Operations teams pull monthly availability data to close SLA with internal areas and external customers.
- Engineering teams open the recurring alerts report to attack the root cause of chronic issues.
- Infrastructure managers look at the capacity report to decide on hardware purchases or cloud right-sizing.
- Audit and compliance download reports as PDF or Excel to attach to regulatory packages and governance reviews.
- Leadership tracks month-over-month trends without diving into operational detail.
The list
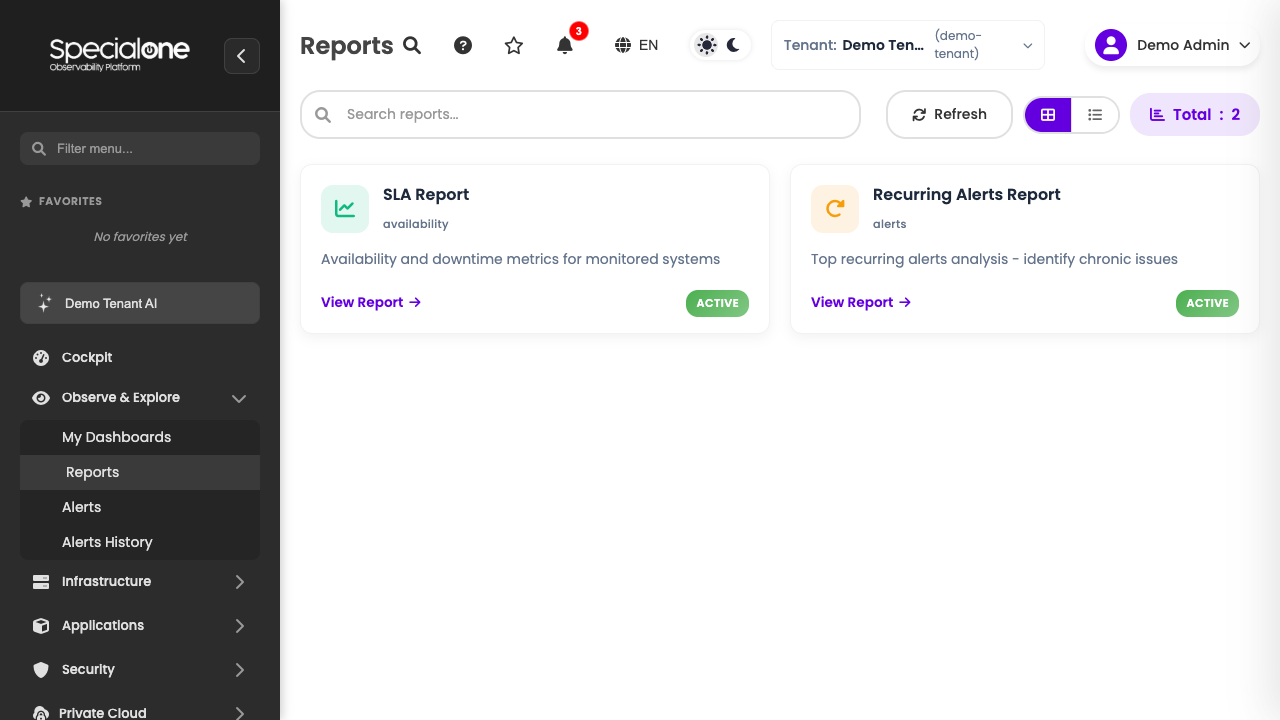
Accessed from Observe & Explore → Reports. The page shows a catalog of cards, one per available report, with icon, title, short description and a View Report link that opens the specific screen.
Above the catalog sit the controls:
- Search reports: filters the cards by name substring in real time. Useful when the catalog grows and you know exactly which report you want.
- Refresh: reloads the list to reflect any new reports enabled for this tenant.
The cards are actionable via the View Report button. Each report opens in its own page with its filters, KPIs, tables and export options.
Catalog varies per tenant
Not every tenant has all reports enabled. The list shown here reflects what is available for your contract. If something is missing, talk to the SpecialOne team to evaluate adding it.
Available reports
Today the catalog covers three big areas: availability, operational noise and capacity. Each one has a dedicated page with detailed explanation of filters, KPIs and how to read them.
SLA Report
Shows the availability and downtime of monitored systems, aggregated over the chosen period. Calculates uptime percentage, total downtime, number of events and how many hosts and technologies are being monitored.
It is the report used to close contractual SLA: you pick the reference month or a custom range, filter by system (Linux, Windows, Firewall, ICMP, Network, etc) and export the result to Excel or PDF.
Recurring Alerts Report
Lists the top most frequent alerts of the tenant on a 7 or 30 day window. For each alert in the list, it shows total count of occurrences, severity and how many hosts were affected.
Use it to attack chronic problems. Instead of firefighting one by one on the Alerts screen, this report tells you which alerts are flooding the NOC and deserve root cause investigation, threshold tuning or suppression.
See Recurring Alerts report details
Capacity Report
Analyzes the use of CPU, memory and disk of the tenant hosts across the chosen period (default last 7 days) and classifies each host into one of four buckets:
- Healthy: within expected limits.
- Warning: starting to approach the limit, deserves attention.
- Over Utilized: past the limit, risk of degradation or unavailability.
- Under Utilized: very idle, candidate for downsizing to save resources.
Lets you customize the classification thresholds and compare two periods side by side to see evolution.
Reports complement, do not replace alerts
The Capacity Report does not fire a notification when a host turns Over Utilized, it only shows the state at query time. To be notified in real time, configure alerts with equivalent thresholds on the hosts or on the monitoring profiles.
When to use Reports versus other screens
The platform has several visualization fronts, each with its own role. Use the table below to choose where to start:
| Situation | Recommended screen |
|---|---|
| Periodic analysis (monthly, quarterly) for compliance or planning. | Reports |
| Real-time, custom visualization of what matters to my team. | My Dashboards |
| Immediate operational response, "what is firing right now". | Alerts |
| Case-by-case investigation of an incident that already closed. | Alerts History |
| Aggregated tenant health for quick on-call check. | Cockpit |
In other words: Reports looks at the past in a consolidated way, Dashboards looks at the present with flexibility, Alerts pulls you to act now, History gives you context for specific incidents and Cockpit keeps the executive summary always at hand.
Export
Pretty much every report offers to export the current query result in three formats:
- CSV: great to open in a spreadsheet, cross with other sources, feed into a data pipeline.
- Excel (
.xlsx): same content as CSV but already with spreadsheet formatting, useful to send to business areas. - PDF: closed layout, ready to attach to a ticket, email or audit package.
The Export button sits in the top right corner of each report and opens a dropdown with the supported options. On reports with several tabs (like the SLA Report), each tab has its own export option focused on that view content (for instance, Export Details and Export Events in the SLA Report).
Export respects applied filters
The generated file contains exactly what is on screen at the moment of the click. If you filtered by a specific system or tweaked the period, the export inherits those filters. Before sending it to an external customer, it pays to check the screen one last time.
Standardize file naming
The platform generates descriptive file names (including tenant, report type and period), but it pays to agree internally on an organization pattern for sharing (SLA_<customer>_<month>_<year>.pdf, for example) to make it easier to find old files.
Empty state
If the catalog has no visible card (due to a too restrictive search or absence of enabled reports), the page shows a guidance message. Check whether there is text in the Search reports field narrowing the result too much, and use the Refresh button if you suspect a new report has been enabled and has not appeared yet.
Next steps
-
SLA Report
Availability, downtime and events by system, with Excel and PDF export.
-
Recurring Alerts
Top most frequent alerts in 7 or 30 days, count and affected hosts.
-
Capacity Report
Host classification into Healthy, Warning, Over Utilized and Under Utilized, with customizable thresholds.