Technologies
The Technologies page is where you track the health of the business products and services running on the infrastructure: Active Directory is responding, IIS is serving pages, last night's Acronis backup completed, the SEFAZ portal is up.
Unlike the Hosts page, which looks at the server as a whole (CPU, memory, disk), the focus here is on the product itself. The question this screen answers is simple: "is service X that my business depends on actually working?". Each row is a monitored instance of a technology known to the platform, with native checks specific to that product.
Access it from Applications → Technologies.
Who uses it
Three personas live on this screen day to day:
- SRE and on-call: scan the list during an incident to correlate "IIS went down" with the host that is red on another screen. The Availability column is the opening thermometer.
- Operations: track backups, jobs and external portals (SEFAZ, Power BI) to make sure business routines are closing as expected.
- Support and service desk: use the search by server or IP to quickly answer tickets of the type "system X is not opening".
Technology versus host
The same server can show up on several rows here, one for each technology it exposes. A Windows Server running AD, IIS and DHCP appears three times, one row per product. That is intentional: each product is treated as an independent service, with its own health.
The catalog
The platform ships a catalog of natively supported technologies. Each one comes with its own monitoring profile that applies the right metrics and alerts for that product.
| Technology | What the check verifies |
|---|---|
| DNS | Name resolution working, query latency, critical records returning the expected value. |
| Active Directory (AD) | Domain controller health: replication, sysvol, authentication, LDAP response time. |
| Apache HTTP Server | Server responding on the expected port, worker status, request rate, error presence. |
| IIS | Microsoft Internet Information Services up, application pools running, individual sites responding. |
| iDRAC | Dell remote management reachable out-of-band: hardware status (PSUs, fans, physical disks, memory), iDRAC controller health. |
| n8n | Workflow orchestrator active, workers connected, queue moving, failed jobs in recent runs. |
| DHCP | DHCP server answering, pools with free addresses, healthy lease time. |
| Acronis | Backup job results: success, failure, age of the most recent backup, agent alerts. |
| Print Server | Windows Print Spooler active, print queues without lockups, shared printers reachable. |
| SAP | SAP system health: application instance responding, work processes, dispatchers, database connection. |
| Power BI | Power BI Service API status, datasets refreshing, on-premises gateways active. |
| SkyOne | Availability of the SkyOne product suite integrated to the environment. |
| SEFAZ | Status check against the NF-e portal of the Brazilian Federal Revenue: production and contingency environments, response time, service return. |
The catalog grows on demand
The catalog is maintained by the SpecialOne team. As new integrations are released, new technologies appear automatically for any tenant that applies the matching profile. Nothing to update on the customer side.
The list
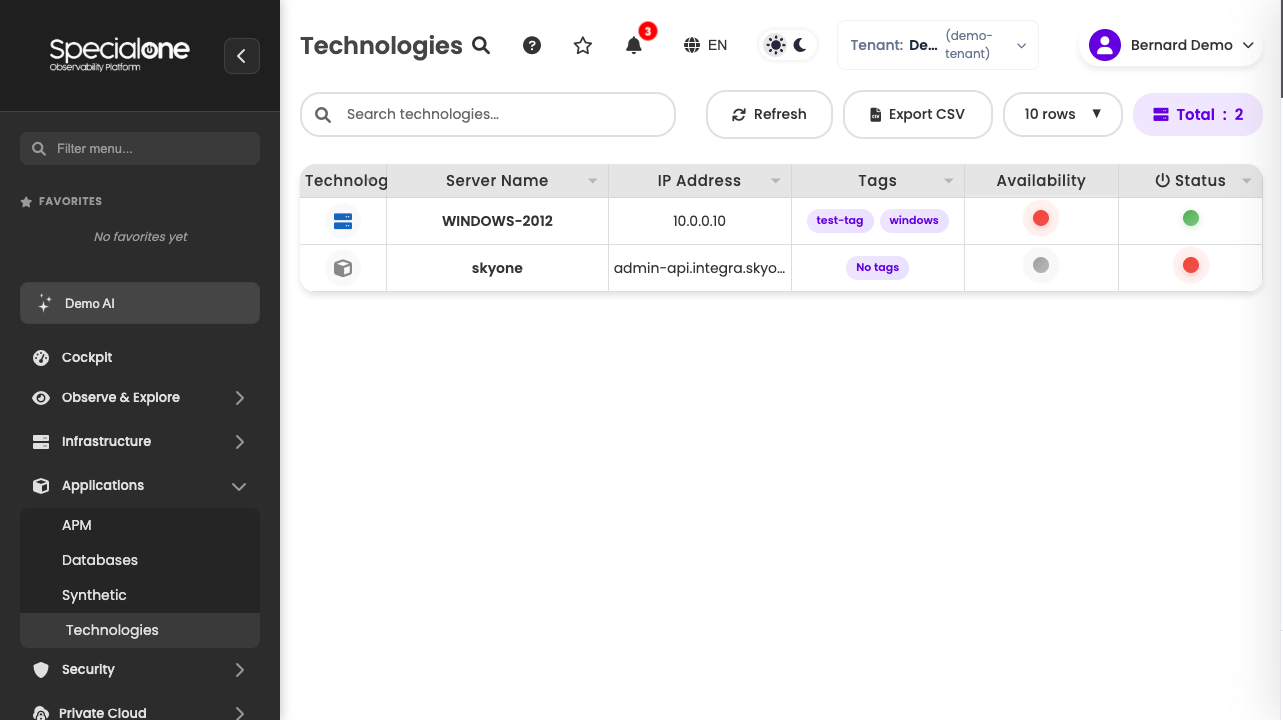
The main table lists every technology instance monitored in the tenant. Columns, all sortable:
| Column | Content |
|---|---|
| Technology | Product icon and name (e.g. IIS, Active Directory, Acronis). Identifies which profile is active on that row. |
| Server Name | Server where the product runs (e.g. srv-iis-01, dc-prd-corp). |
| IP Address | IP the collector uses to reach the instance. |
| Tags | Free labels used in filters and notification rules (e.g. production, critical, sp-branch). |
| Availability | Colored circle with the current check state. Color meaning on the next section. |
| Status | On/off icon indicating whether collection is active or paused. |
At the bottom of the table sit the pagination and the Rows per page option (5, 10, 25, 50, 100).
Top action bar
Above the table sit the standard controls:
- Search: free field that filters by technology name, server name, IP or tag. Filters as you type.
- Refresh: forces a data reload, ignoring the auto-refresh interval.
- Export CSV: downloads the current filtered list (handy to drop into an inventory spreadsheet or attach to a ticket).
- Rows per page: adjusts pagination.
- Total: N: counter on the right corner, shows how many instances match the current filter.
Availability states
The Availability column uses four colors, each with a defined meaning:
| Color | Meaning |
|---|---|
| Green | The technology responded on the last check within the expected time. It is OK. |
| Red | The technology is failing. The red circle has a ripple animation to draw attention on NOC walls and visual triage. |
| Orange | There is a scheduled maintenance covering the instance. Alerts may be silenced and the real state is subordinated to the maintenance window. |
| Gray | No data arrived in the last 2 hours. Could be a stopped collector, a downed agent, a freshly applied profile that has not run its first check yet, or broken connectivity between collector and instance. |
Gray does not mean everything is fine
Gray is absence of information, not confirmation of health. When an item flips from green to gray, treat it as suspect: someone stopped the agent, the collector is offline, or the network changed. Check the host agent before dismissing it.
The 2-hour window used to classify as gray is the same criterion that governs the stale state on other screens. Short enough to catch a stopped agent within the same shift, wide enough to tolerate checks with multi-minute collection intervals.
How a technology lands here
The Technologies page has no "Add" button today. Instances appear here as a consequence of two things:
1. Apply a monitoring profile on an existing host
The normal path:
- Make sure the server is in Infrastructure → Hosts with an active agent. See the walkthrough on Hosts.
- Open the host detail → Configuration tab → CI Configuration sub-tab.
- On the Monitoring profiles card, add the profile for the technology you want to monitor (e.g.
IIS,Active Directory,Acronis). - Within a few minutes the first collection runs and the instance shows up here at Applications → Technologies, with the row already on the right state (green if it responded, red if it failed).
The Technology column on the list is, in practice, the reflection of which technology profile is applied on that host. Applying more than one technology profile on the same host generates more than one row here, one per product.
2. The catalog is maintained by the SpecialOne team
The list of supported technologies in the catalog is maintained by SpecialOne. As new integrations are released (a new backup product, a new market product), the matching profile becomes available and any tenant can apply it on a host.
This means instance registration goes through the normal host flow (apply profile), while adding a new category (a technology not yet in the catalog) goes through the SpecialOne product team.
I do not see the technology I need
Two possible situations:
The technology is in the catalog, but the row does not appear. Check in order:
- Is the host where the product runs registered in Hosts with a green agent?
- Was the monitoring profile for that technology applied on the host (host Configuration tab)?
- Has enough time passed for the first collection? Usually five minutes is enough; on cases with longer intervals, up to fifteen.
- Is the instance gray for more than 2 hours? That points to a collection failure, not lack of registration. Investigate the agent and the collector.
The technology is not in the catalog. The catalog is closed and maintained by SpecialOne. If you need to monitor a product not on the list in The catalog section:
- Open a ticket with SpecialOne support describing the product, version, how it exposes metrics (API, command, log, SNMP) and the kind of check expected.
- In parallel, you can use generic host monitoring or create manual alerts on custom metrics, depending on the case. Support helps decide.
Why the catalog is closed
Keeping the catalog curated by SpecialOne guarantees the checks for each technology are tested, standardized and updated with product evolutions. In return, customers get a ready profile with calibrated alerts, instead of building everything from scratch. When demand is recurrent, the technology enters the catalog and becomes available to everyone.
Limits
Some numbers to size your usage:
- Rows per page: the selector allows 5, 10, 25, 50 or 100. The hard cap is 100 rows per page; on tenants with hundreds of instances, use the search by tag or IP to filter before paginating.
- Gray classification window: instances with no data on the last 2 hours show up gray.
- API timeout: list queries have a 30-second timeout. On rare cases with very large tenants and wide filters it can time out; refine the search or pagination in that case.
- Catalog: the list of supported technologies is closed and updated by the SpecialOne team. See I do not see the technology I need.
- Alert severity: alerts from this page follow the platform standard, with severities Critical, High, Medium and Information.
Next steps
-
Hosts
Instance registration happens via host. Apply the technology profile on the host Configuration tab.
-
Inventory
Consolidated view by category of everything cataloged in the tenant.
-
Alerts
Technology alerts follow the same routing flow via channels and notification rules.
-
Concepts
Monitoring profile, metric, alert, maintenance. The platform vocabulary in full.