SLA Report
The SLA Report shows, for a chosen period, how long each monitored system stayed available and how long it was down. It is the screen you open when you need to justify availability on a contract, close a monthly operations review or investigate specific outages a customer complained about.
The read is straight: five KPIs at the top summarize the period, and three tabs unfold the story by system/technology, by individual host or as an event timeline. Everything can be exported as Excel or PDF to attach in a formal report.
Who uses it
- Operations managers run the report at the start of each month to close the previous month's SLA.
- Account leads prepare material for governance meetings with the customer, showing availability by system.
- On-call teams open the report after a major incident to quantify impact.
- Audit and compliance save periodic exports as documented evidence.
How to open
Accessed from Observe & Explore → Reports → SLA Report, or directly at /reports/sla. The page loads with the current month period and All Systems/Technologies filter applied, ready to be adjusted.
The screen
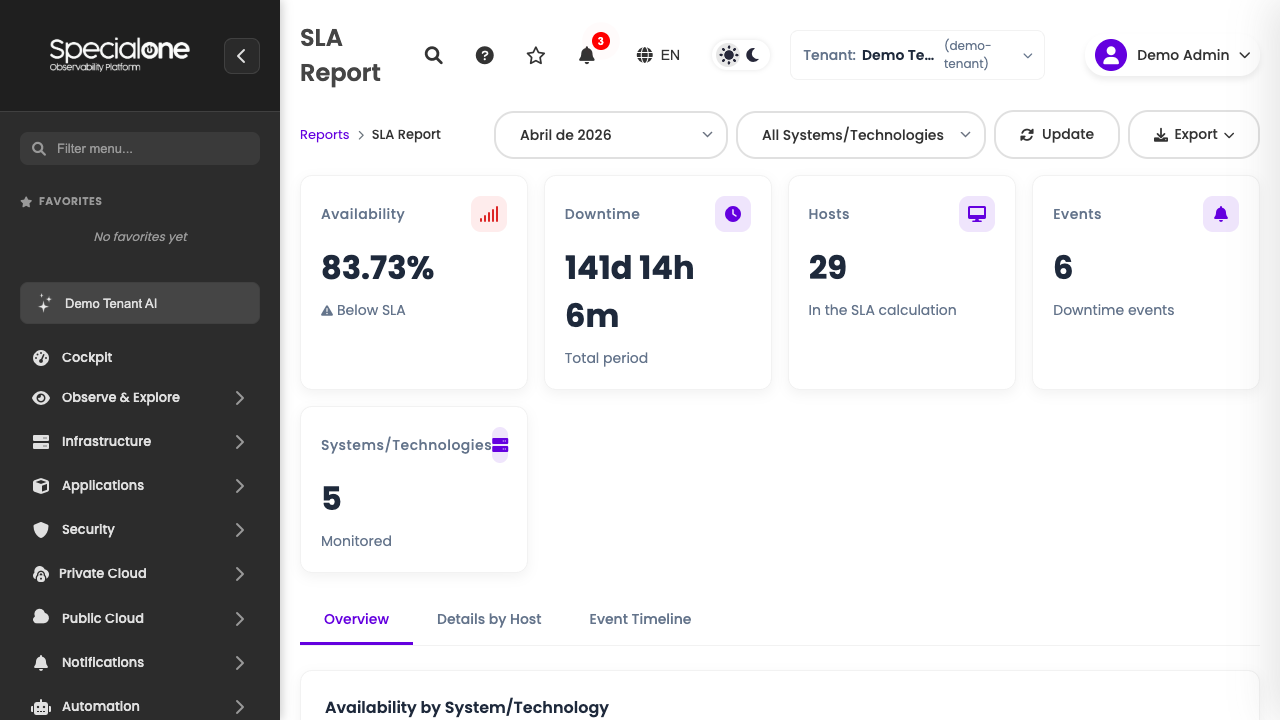
The page has three main blocks stacked top to bottom:
- Filter header: period, system/technology, update button and export dropdown.
- Five KPIs: availability, downtime, hosts, events and systems/technologies.
- Three detail tabs: Overview, Details by Host and Event Timeline.
Header filters
The header lets you set the slice of the report before generating.
Period
Dropdown with five fixed options:
- Current month (default).
- Last month.
- Two months ago.
- Three months ago.
- Custom Range: unlocks two fields From and To to pick exact date and time.
Change the period and click Update to recompute everything. The page does not refresh automatically when you switch filters.
System/Technology
Dropdown that scopes the calculation to a specific host category: Linux, Windows, Network, Firewall, ICMP, among others present on the tenant. The All Systems/Technologies option shows the consolidated view.
This filter restricts both the top KPIs and the three tabs. It is useful to answer questions like "what was the network SLA in April?" without diving into details.
Update
The green Update button kicks off the recompute with current filters. Since the calculation scans the full collection period, it can take a few seconds on long windows.
Export
The Export dropdown has two options:
- SLA Report Excel:
.xlsxfile with KPIs, summary by system/technology and host details on separate sheets. - SLA Report PDF: file ready to attach to minutes, with chart, detailed table and tenant logo.
Each tab (Details by Host and Event Timeline) also has its own export buttons in CSV, Excel and PDF to download just that slice.
The five KPIs
The top card strip is the quickest read of the period.
| KPI | What it shows |
|---|---|
| Availability | Consolidated overall percentage (e.g. 99.85%). Comes with a colored indicator: Below SLA (red) when missing the target configured for the tenant, Within SLA (green) otherwise. |
| Downtime | Total summed downtime in the period (e.g. 2h 15m, 1d 4h 6m). The absolute counterpart of the percentage. |
| Hosts | Count of hosts considered in the calculation. Hosts paused or on planned maintenance the entire time are not included. |
| Events | Count of downtime events detected. A single host can have several events across the period. |
| Systems/Technologies | Count of categories monitored in the slice. When you filter by a specific category, this value drops to 1. |
SLA target per tenant
The threshold defining Below SLA versus Within SLA is configured per tenant (default 99.5%). If your operation works with a different contractual SLA, ask the tenant administrator to adjust so the colored indicator reflects your contract reality.
Overview tab
The default tab shows a horizontal bar chart with availability by system/technology in the period. Each bar is a category (Linux, Windows, Network, etc) and the bar size represents the percentage.
The read is quick: nearly full bars indicate stability, short bars draw attention for investigation. The axis runs from 0 to 100 percent.
Click a bar to focus on that system/technology: the header filter updates, the top KPIs recompute and the other tabs start showing only hosts of that category. To return to the consolidated view, pick All Systems/Technologies in the dropdown and refresh.
Use Overview as a starting point
Before diving into the host table, look at the chart. Almost always a single category concentrates the problem. Clicking the bar saves filtering time.
Details by Host tab
The second tab brings the full table, host by host, of the filtered slice.
| Column | Content |
|---|---|
| System/Technology | Host category (LINUX, WINDOWS, NETWORK, etc), in uppercase. |
| Location | City, datacenter or label set on the host tags. |
| Host | Display name of the host. Clicking takes you to the host detail. |
| Availability | Percentage in the period. |
| Downtime | Total time down in the period. |
| Description | Optional summary configured on the host. |
| Status | Consolidated overall state at the end of the period (available, unavailable, on maintenance). |
The table supports search on any textual column and sorting on any column (click the header to toggle ascending/descending). The Export Details button downloads just this tab as CSV, Excel or PDF.
Use this tab when a customer complains about a specific host: filter by the host name on the table search and look at availability and downtime in the slice they mention.
Event Timeline tab
The third tab is the chronological story of outages. Each row is a downtime event, oldest to newest.
| Column | Content |
|---|---|
| Start Time | When the event started (timestamp). |
| End Time | When the event was resolved. Blank when the event is still open at the end of the slice. |
| System/Technology | Category of the affected host. |
| Location | Same criterion as the host tab. |
| Host | Host that went down. |
| Duration | How long the event lasted (e.g. 2h 15m). |
| Description | Text of the alert that opened the event. |
The Export Events button downloads this table as CSV, Excel or PDF.
Click a row to open the Alerts History already filtered by the host and the day of the event. It is the recommended path to investigate root cause.
Pair the timeline with Alerts History
The timeline shows the events that weighed on the SLA. Alerts History shows everything that happened in that window, including smaller alerts that did not drop availability but may explain incident context.
How the SLA is calculated
The base equation is simple:
A few important rules:
- Planned maintenance does not count as down: hosts on maintenance during the period have the maintenance time excluded from both downtime and total time. The calculation becomes about the time the host was actually operating.
- Information severity does not enter the calculation: by default, alerts with Information severity generate events visible on the timeline but do not impact the availability percentage. The calculation considers only alerts with Critical, High and Medium severity.
- Hosts paused the entire period do not enter: hosts inactive during the whole slice are excluded from the Hosts KPI count.
- Events crossing the period boundary: when an event started before the slice or ends after, only the portion falling inside the slice is counted.
Consolidated availability is not a simple average
The percentage on the Availability KPI is calculated over the aggregated total time of all hosts, not as the arithmetic mean of individual percentages. A very unstable host pulls the consolidated number proportionally to its weight in monitored time.
Use cases
The page was designed for a few recurring flows.
Monthly closing
At the start of each month, open the report, pick Last month in the period dropdown, keep All Systems/Technologies and click Update. Export the SLA Report PDF and attach to the executive report. The PDF already comes with the chart, KPIs and the detailed table.
Uptime complaint about a specific host
The customer says server X went down several times last week. Pick Custom Range, define From and To covering the week, open the Details by Host tab and search the host name. The row shows downtime in the period. To detail further, open the Event Timeline tab and filter by the host (table search) to list each outage.
Investigation of clustered outages
There were several outages over the weekend and you want to understand if there is a pattern. Open the Event Timeline tab, sort by Start Time and read the sequence. Clicking a row takes you to the Alerts History of that moment and opens the possibility to cross with other correlated alerts.
Planning and trend
Compare availability month over month by switching the period filter between Current month, Last month, Two months ago and Three months ago. Screenshot the KPIs (or export) on each slice to track trend. It is the base to defend modernization investment on a chronic system.
Limitations
A few constraints to keep in mind.
- Practical maximum period: 90 days. Above that, calculation performance degrades because the backend scans the whole collection window. For longer windows, prefer to segment (three 30-day windows, for example) or export and consolidate offline.
- Drilldown respects user timezone. Timestamps shown on tables and drilldown links use the timezone configured on your account. If you share an export with someone in another timezone, mention it.
- Hosts created mid-period. A host added in the middle of the slice has the calculation done only over the time it existed. This can skew month-over-month comparisons when there is heavy churn on the host list.
- No cache across filters. Each Update redoes the query from scratch. On long windows, avoid switching filters without need.
Next steps
-
Recurring Alerts
Top alerts firing the most in the period. Useful to identify chronic issues that slip past raw SLA.
-
Capacity
Host classification into over utilized, warning, healthy and under utilized. Complementary view to SLA for planning.
-
Alerts History
Where the SLA timeline drills down. Shows everything that happened, including alerts that did not weigh on availability.